Part 2: The financial health of electricity distribution businesses
2.1
In this Part, we outline the financial health of electricity distribution businesses as a whole based on publicly available financial information.3
2.2
Electricity distribution businesses vary significantly in size. Vector Limited and Powerco Limited are the largest companies by consumer coverage. In 2015/16, these two companies together earned more than 40% of consolidated sector income and owned more than 40% of consolidated sector assets.
2.3
There are 18 electricity distribution businesses that we refer to as trust-owned companies and they are fully owned by community or consumer trusts.4 The remaining 11 electricity distribution businesses we refer to as non-trust-owned companies. They have various owners, including a mix of community or consumer trusts that own some but not all shares, local authorities, other electricity distribution businesses, private interests, and the public (through co-operatives or being publicly listed). Non-trust-owned companies include Vector Limited5 and Powerco Limited, so they are a bigger group (in regards to revenue and customer numbers) than the trust-owned companies.
Our summary of the financial health of electricity distribution businesses
2.4
We have not identified any significant concerns with the financial health of electricity distribution businesses as a whole. The core distribution business is profitable. More widely, electricity distribution businesses have provided double-digit profits and dividends and discounts as a proportion of income in each financial year since 2011/12. Electricity distribution businesses have relatively low levels of debt, which means that they have the financial flexibility to respond to unexpected changes in the short term.
2.5
Electricity distribution businesses as a whole continue to invest in their networks throughout the country. The level of investment means that electricity distribution businesses are maintaining the average age of the networks, which should help to provide a reliable supply of electricity to consumers in the future.
2.6
However, the networks of four individual electricity distribution businesses appear to be getting older, which could mean additional expenditure in the future to maintain their operations.
2.7
Another risk in operating ageing networks include an increased risk of asset failure, which might reduce the likelihood of a reliable power supply. Ageing networks could also pose a health and safety risk to employees and the wider community.
2.8
Electricity distribution businesses with ageing networks may need to factor increases for future maintenance and capital expenditure into their budgets (see Part 4).
2.9
We encourage all electricity distribution businesses to consider whether they are adequately identifying and managing the risks associated with ageing networks.
Our approach to reviewing the financial health of electricity distribution businesses
2.10
To assess the financial health of all electricity distribution businesses, we started with audited annual financial statements. In our analysis, we looked at:
- what the electricity distribution businesses' income and profits are, and whether they are increasing compared with previous years;
- the amount of dividends and community discounts the electricity distribution businesses made and how they compared with previous years; and
- how much debt electricity distribution businesses have and whether the debt is becoming difficult to manage.
2.11
Because we are looking at asset management, we also wanted to understand how much electricity distribution businesses' main assets (the core distribution network) were worth, and how much was being reinvested in these assets.
2.12
It is important to note that financial health is only one measure of an electricity distribution businesses' performance. Many electricity distribution businesses will look beyond traditional measures of profit and return on investments to include safety, environmental, and social aspects. Although these are important, we have not commented on them except for the three companies we look at in Parts 3 to 5.
2.13
There were limitations to how we could use the audited financial results in analysing the information from electricity distribution businesses because reporting can vary:
- We used the consolidated results. We would have preferred to analyse the parent-only results because our focus for this report is on the core distribution business. However, parent-only results were not available for every financial year we considered. From 2014/15, companies have had the option to report only consolidated financial statements.6 Several electricity distribution businesses took advantage of this option in 2014/15 and 2015/16.
- Electricity distribution businesses do not have a common balance date so the financial results we analysed cover different time periods. Some companies also changed their balance dates during the period we reviewed, which meant some results were reported for nine months or 15 months.
- Financial reporting standards allow entities to value an item of property, plant, and equipment at either cost or fair value.7 Individual electricity distribution businesses can use either approach, which reduces comparability.
2.14
Because of the differences in the audited financial results, we also analysed the information that electricity distribution businesses prepare to comply with the Commerce Commission's Electricity Distribution Information Disclosure Determination8 (the Determination).
2.15
The Determination sets rules for the financial information disclosed by electricity distribution businesses, including setting the end of the financial year as 31 March. The Commerce Commission also requires the information disclosed to be audited and made available to the public. These rules make the information comparable for all electricity distribution businesses.
2.16
When we refer to the financial results of the core business, we mean the financial information prepared in accordance with the Determination.
Consolidated financial results of electricity distribution businesses
2.17
We derived and analysed the consolidated financial information of 26 electricity distribution businesses for the 2011/12 to 2015/16 financial years.9 Consolidated financial information includes the wider business, not just the results related to the core network for which electricity distribution businesses' returns are set. There were limitations to how we could extract information (see paragraph 2.13). Additionally, we reviewed regulatory financial information for the same time period (see paragraph 2.20). Figure 2 summarises the main consolidated financial information from our analysis of electricity distribution businesses.
Figure 2
Main consolidated financial information for 26 electricity distribution businesses, 2011/12 to 2015/16
| 2011/12 $m | 2012/13 $m | 2013/14 $m | 2014/15 $m | 2015/16 $m | |
|---|---|---|---|---|---|
| Total income | 3,196 | 3,588 | 3,742 | 4,080 | 4,193 |
| Profit after tax | 415 | 467 | 486 | 463 | 635 |
| Dividends paid | 281 | 297 | 296 | 316 | 337 |
| Community discounts paid | 87 | 91 | 94 | 94 | 99 |
| Total dividends and discounts | 368 | 388 | 390 | 410 | 436 |
| Property, plant, and equipment | 11,006 | 11,392 | 11,867 | 12,324 | 12,308 |
| Total assets | 13,719 | 14,093 | 14,692 | 15,544 | 15,717 |
| Net debt* | 4,392 | 4,435 | 4,646 | 5,315 | 5,019 |
| Total liabilities | 7,137 | 7,293 | 7,541 | 8,245 | 8,177 |
| Total equity | 6,582 | 6,800 | 7,151 | 7,299 | 7,540 |
Note: Electricity distribution businesses use either a 31 March or a 30 June year-end for financial reporting purposes. We have made no adjustment for the different financial year-ends in the table above.
* We calculated net debt as all recognised external debt, finance lease liabilities, and bank overdrafts, less financial investment assets such as cash and cash equivalents and term deposits.
Financial results of the core business
2.18
The Determination requires electricity distribution businesses to disclose financial performance and regulatory asset information. Regulatory assets are made up of property, plant, and equipment that are related to the core distribution business. The financial information is prepared under regulatory rules that draw on generally accepted accounting practice. The regulatory rules are set out in the Commerce Commission's Electricity Distribution Services Input Methodologies Determination 2012.
2.19
The regulatory rules set a common revaluation policy for regulatory assets and a common capital structure when calculating the regulatory financial results. The revaluation policy requires all assets to be revalued each year in line with movements in the consumer price index. The regulatory rules assume a level of debt to assets of 44%.10
2.20
Figure 3 sets out the regulatory financial performance of all 29 electricity distribution core businesses from 2011/12 to 2015/16.11 The Determination does not require the disclosure of financial information that includes distributions to owners, liabilities, and equity.
Figure 3
Electricity distribution businesses' regulatory results, 2011/12 to 2015/16
| 2011/12 $m | 2012/13 $m | 2013/14 $m | 2014/15 $m | 2015/16 $m | |
|---|---|---|---|---|---|
| Regulatory income | 2,089 | 2,252 | 2,280 | 2,493 | 2,488 |
| Regulatory profit after tax | 372 | 373 | 392 | 395 | 411 |
| Regulatory asset base (property, plant, and equipment) | 9,390 | 9,637 | 9,985 | 10,253 | 10,554 |
2.21
Trust-owned companies are a smaller proportion (both in terms of revenue and customer numbers) of all electricity distribution businesses, making up about 33% of total regulatory income in 2015/16.
The income of electricity distribution businesses is increasing
2.22
As can be seen in Figure 2, the income of electricity distribution businesses as a whole increased by 31% to just under $4.2 billion from 2011/12 to 2015/16. In our view, there are two main reasons for this. First, electricity distribution businesses increased prices. This was to reflect price increases from Transpower Limited and to cover the cost of reinvestment in the core business, such as to accommodate growth in customers. When focusing on the core business, regulatory income increased by 19% from 2011/12 to 2015/16. Secondly, electricity distribution businesses as a whole continued to increase their unregulated businesses, such as contracting revenue. Because electricity distribution businesses are not consistent in how they disclose their income, we cannot provide any further analysis of this increase.
2.23
We considered whether there was a difference in revenue growth between trust-owned and non-trust-owned companies. Trust-owned companies' regulatory income has increased at a faster rate (25%) than that of non-trust-owned companies (16%). One reason for this is because 12 of the 18 trust-owned companies are not subject to regulatory price control and can increase prices at a faster rate than non-trust-owned companies.
What levels of profits and returns are electricity distribution businesses achieving?
2.24
Electricity distribution businesses as a whole recognised $2.5 billion in profits after tax and distributed $2.0 billion during the five years (see Figure 2).
2.25
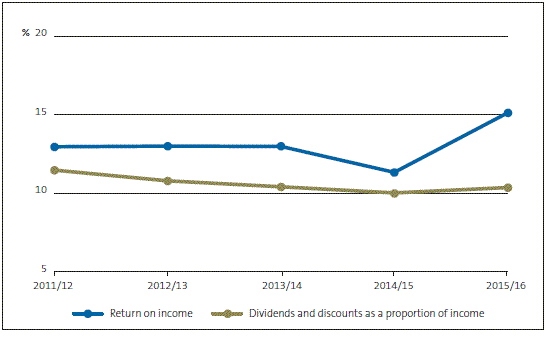
Figure 4 shows profits and dividends and discounts as a proportion of income for electricity distribution businesses as a whole.12 The increase in 2015/16 followed Vector Limited's sale of some of its gas distribution interests, which resulted in a $164.1 million gain.
Figure 4
Electricity distribution businesses' reported returns on income, and dividends and discounts as a proportion of income, 2011/12 to 2015/16

2.26
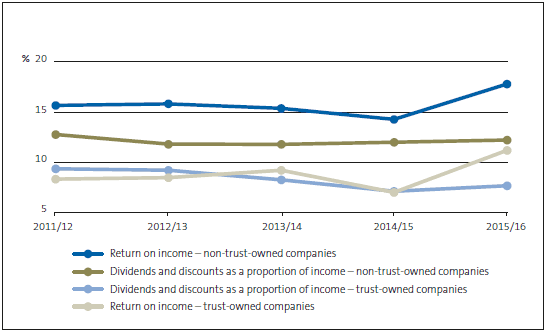
Figure 5 compares the "return on income" and "dividends and discounts as a proportion of income" of trust-owned companies with other non-trust-owned companies. During the five-year period, trust-owned companies made lower returns and distributed less compared with non-trust-owned companies.
Figure 5
Reported returns on income, and dividends and discounts as a proportion of income, by ownership type, 2011/12 to 2015/16

Net debt levels are low
2.27
As a whole, electricity distribution businesses have relatively low net debt levels, ranging between 32% and 35% of total assets during the period we reviewed. For individual electricity distribution businesses, net debt levels at the end of 2015/16 ranged from -14% (where the electricity distribution business recognised no debt but did have cash and cash equivalents) to 58%.
2.28
The amount of debt held by electricity distribution businesses differs by ownership type. Trust-owned companies' net debt was low, about 22% of total assets by 2015/16. In comparison, non-trust-owned companies had net debt of about 39%.
Electricity distribution businesses are reinvesting in their core business
2.29
Electricity distribution businesses as a whole continue to invest in their networks (the regulatory asset base). Since 2011/12, the regulatory asset base increased 12% to $10.6 billion. About 25% of this increase relates to the annual revaluation of assets and the remaining 75% relates to capital expenditure on the networks.
2.30
Network investment includes:13
- new assets to cater for new connections or system growth;
- expenditure to relocate assets (for example, putting overhead lines underground);
- expenditure to improve the reliability and safety of the networks; and
- the renewal and replacement of assets.
2.31
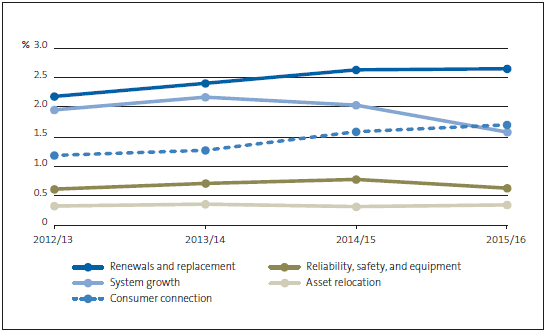
Figure 6 outlines the capital expenditure as a percentage of the regulatory asset base.14 Electricity distribution businesses as a whole spent the largest amount on renewing the networks. A significant amount of expenditure was also incurred from connecting new consumers and catering for system growth. When we analysed the results by owner, the network investment made by electricity distribution businesses does not show any other significant trends.
Figure 6
Capital expenditure for all electricity distribution businesses as a percentage of the regulatory asset base, 2012/13 to 2015/16

2.32
We expect electricity distribution businesses to maintain the average age of the overall network. Based on information that electricity distribution businesses have disclosed about the age of their networks, they, as a whole, have maintained the age of the overall network at around one-third of its expected useful life since 2012/13. Maintaining the networks in this way should help to ensure a reliable supply of electricity throughout the country.
2.33
However, the age of some networks increased during the four-year period.15 These electricity distribution businesses will need to ensure that this increase in the average age of their networks does not adversely affect the quality of their service.
3: We audit only 20 of the 29 electricity distribution businesses. However, to adequately discuss the financial health of the sector, our analysis covers public and private electricity distribution businesses.
4: These are: Buller Electricity Limited, Centralines Limited, Counties Power Limited, Eastland Network Limited, Electra Limited, MainPower New Zealand Limited, Marlborough Lines Limited, Network Tasman Limited, Network Waitaki Limited, Northpower Limited, Scanpower Limited, The Lines Company Limited, The Power Company Limited, Top Energy Limited, Unison Networks Limited, Waipa Networks Limited, WEL Networks Limited, and Westpower Limited. In July 2015, Eastern Bay Energy Trust became the sole shareholder of Horizon Energy Distribution Limited. We have not included Horizon Energy Distribution Limited in this subcategory because for other years it was not fully trust-owned.
5: Entrust, a community trust, owns 75.1% of Vector Limited. Because it is not fully owned by the community trust, we have included Vector Limited in our category of non-trust-owned companies.
6: Up until the 2014/15 financial year, companies with subsidiaries were required by the Financial Reporting Act 1993 to include both parent and group figures in their financial statements. This Act was repealed from 1 April 2014, and companies with subsidiaries were no longer required to include parent figures in their financial statements.
7: External Reporting Board (2015), New Zealand Equivalent to International Financial Reporting Standard 16: Property, Plant and Equipment (NZ IAS 16), Wellington.
8: Commerce Commission (2015) Electricity Distribution Information Disclosure Determination 2012 (consolidated in 2015).
9: Wellington Electricity Lines Limited's financial statements are not publicly available. Additionally, Nelson Electricity Limited and OtagoNet Joint Venture are owned by other electricity distribution businesses. Because the results of these entities are reported in their owner's financial statements, we did not separately include them.
10: Commerce Commission (2015), Electricity Distribution Services Input Methodologies Determination 2012, page 61.
11: For consistency purposes, we have analysed only regulatory information prepared in accordance with the Determination.
12: We compared profits and distributions to income rather than another metric such as equity, to allow us to do the same analysis when using the regulatory information. The Determination does not require the calculation or disclosure of an equity balance.
13: These are categories that the Commerce Commission defines in the Electricity Distribution Information Disclosure Determination 2012 (consolidated in 2015).
14: We can analyse this information only for the years 2012/13 to 2015/16. Electricity distribution businesses were not required to disclose this information for 2011/12.
15: Greater than one-year increases included: Aurora Energy Limited (from 17.6 years in 2012/13 to 19 years in 2015/16), Electricity Ashburton Limited (8.1 to 9.8), Wellington Electricity Lines Limited (25.7 to 28.4), and Westpower Limited (16.6 to 18.1).

