Appendix: Sensitivity of return on average equity
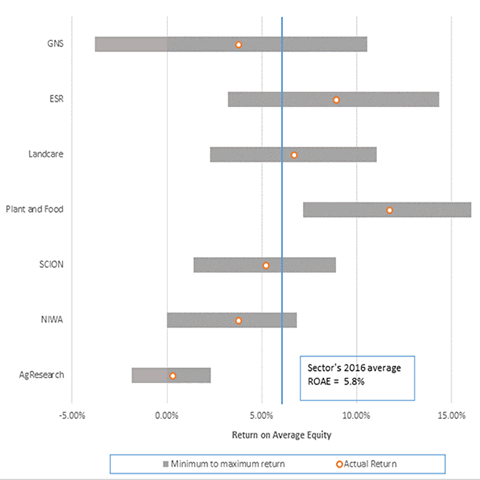
Figure 1 uses the 2016 audited financial statements to show the potential sensitivity of the sector to increases or decreases in operating expenditure, capital expenditure, and commercial revenue. The CRI most sensitive to these changes is GNS Science, which shows the largest potential movement (the grey bar) from its actual return on average equity (the red circle).
It also shows that two CRIs are potentially vulnerable to adverse changes in these financial factors. If adverse changes in expenses and commercial revenues occurred, it is likely that both GNS Science and AgResearch’s Return on Average Equity would fall below zero. The returns on all other CRIs would remain at or above zero.
Figure 1
Sensitivity of return on average equity to the combined changes of +/- 4% in operating expenditure, +/- 20% in capital expenditure, and +/- 5% in commercial revenue

