Part 3: The last seven years of the Government's financial statements
3.1
In this Part, we look back on our auditing of the Government's financial statements during the current Auditor-General's term. We reflect on the main matters and themes that arose during those seven years.
3.2
In the last seven years, global and national economies have experienced major economic shocks. As part of this, the resources of governments have changed, and some of these changes are reflected in the financial statements – for example, in the composition and complexity of the Government's assets.9
3.3
We discuss how the revenue earned, assets owned, and liabilities owed by the Government have changed, as reported in the last seven years of the Government's financial statements.
3.4
When discussing the Government's financial results in this Part, our figures include the amount attributable to minority interests. This is because our audit covers all of the assets and liabilities on the Government's balance sheet. We are interested in the values and performance of economic resources under the Crown's control, whether they are wholly owned by the Government or partly owned by minority shareholders. (Some of the financial data reported in the Government's financial statements are shown net of minority interests to emphasise the amount attributable to the Crown. The difference between those figures and the gross amounts discussed here are usually immaterial.)
Main matters affecting our audits
3.5
We have reported annually on our audits of the financial statements and, in the last seven years, we have reported on 30 matters that have been of great importance in forming our audit opinions on the financial statements.10
3.6
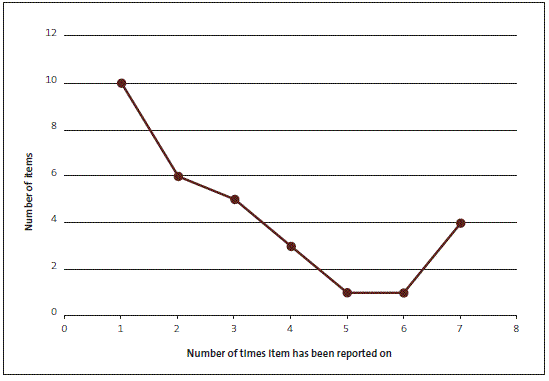
Figure 3 shows the number of matters we have reported on and the number of times they have been reported on. For example, in the past seven years, 10 different matters were reported on only once, and four matters were reported on seven times – every year from 2009/10. One other matter was reported on six times during the seven years.
3.7
The five matters that were reported on six or seven times concerned the recognition of tax revenue, valuation of state highways, discount rates used in valuing long-term liabilities, accounting for the costs of the Canterbury earthquakes, and accounting for liabilities under the Treaty of Waitangi settlements.
3.8
Perhaps unsurprisingly, four of those five matters have featured as "key audit matters" in our 2015/16 audit report on the financial statements (see Part 2).
Figure 3
The number of specific matters we have reported on from 2009/10 to 2015/16 and frequency of reporting
3.9
In the following sections, we discuss briefly how the Government's financial performance and position have changed in the past seven years, some of the challenges for the Government's financial reporting, and some of the areas of audit interest that have arisen.
Government revenue
3.10
Most government revenue is from taxes.11 The Government's tax revenue declined for two consecutive years during the last decade – in 2008/09 and 2009/10. The reduction in tax revenue was mostly due to reductions in corporate and personal income tax rates, declining profits resulting from the worsening economic climate (following the global economic crisis), and declining interest rates.
3.11
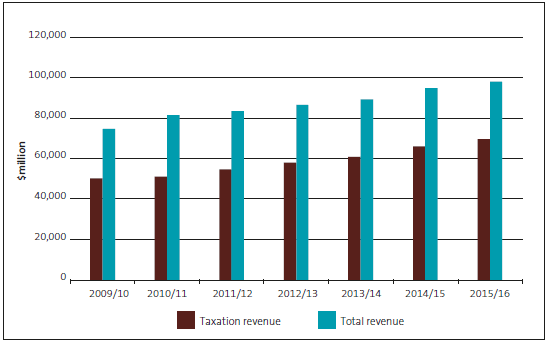
Figure 4 begins with the low point in 2009/10, after which government revenue has increased for each consecutive year. By 2012/13, tax revenue ($58.1 billion) had surpassed the previous high point of 2007/08 ($57.4 billion). In 2015/16, tax revenue was $69.7 billion. It constituted 71% of total Crown revenue of $98.2 billion (up from 67% of total Crown revenue in 2009/10).
3.12
Non-tax revenue12 earned during the same seven-year period remained fairly constant.
Figure 4
Tax revenue and total revenue from 2009/10 to 2015/16
3.13
Tax revenue is generally recognised in the financial statements when assessable income has been earned. Some estimation is required to account for tax revenue from taxpayers who have not filed income tax returns by the end of the financial year.
3.14
When reporting on our audits of the financial statements during the past seven years, we have regularly drawn readers' attention to the calculation of income tax revenue. This is because of the significant judgements and estimations involved. Tax revenue featured as a key audit matter in our 2015/16 audit of the Government's financial statements (see paragraphs 2.13-2.15).
The Government's balance sheet – net worth
3.15
When the first consolidated Government financial statements were published in 1992, the Government's net worth was in deficit. This means that, when applying generally accepted accounting practice, its reported liabilities exceeded its reported assets – by $10.35 billion. It therefore reported "negative equity".13 Despite several national and global economic and financial shocks in recent decades, the financial statements report a positive equity situation as at 30 June 2016 of $95.5 billion.14
3.16
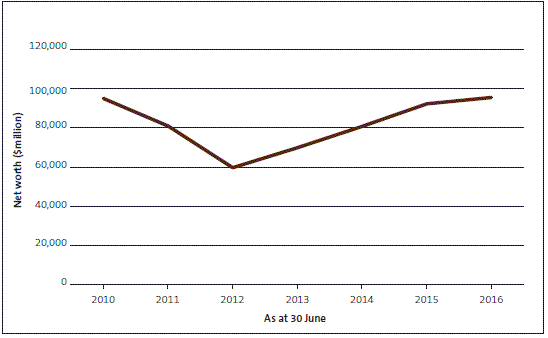
Figure 5 shows that the Government's net worth (including net worth attributable to minority interests) as at 30 June 2016 ($95.5 billion) is about the same as it was at 30 June 2010 ($95.0 billion). It decreased steeply from 2010 to 2012 ($59.8 billion) before recovering steadily from 2013 onward.
Figure 5
Net worth from 2010 to 2016 (including minority interests in listed companies)
3.17
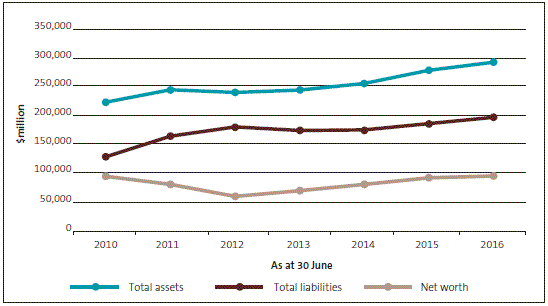
Figure 6 shows the relative movement in what the Government owns (assets), owes (liabilities), and equity (net worth) from the Government's financial statements for the last seven years. It shows a gradual increase in Government net worth since 2012, as the gap between assets and liabilities has gradually widened.
Figure 6
Growth in the Government's assets, liabilities, and net worth (including minority interests in listed companies)
3.18
Net worth increases when the Government's assets gain in value, its liabilities fall in value, or its revenues exceed expenses (which results in a positive OBEGAL).
3.19
Between 2010 and 2012, the Government's net worth decreased, as shown in Figures 5 and 6. The main reason for the decrease in 2010/11 was the significant negative OBEGAL (that is, expenses exceeded revenue). In that year, the OBEGAL was minus $18.4 billion. A major factor in that deficit was the expense resulting from the Canterbury earthquakes.
3.20
Three major reasons for the further decline in 2011/12 were a continuing negative OBEGAL, increases in the values of the long-term liabilities of ACC and the Government Superannuation Fund (GSF)15, and a significant write-down of KiwiRail assets. The write-down of rail assets followed the decision to value some assets on a commercial basis for the purpose of the Government's financial statements. Deteriorating market conditions also affected the valuation.
3.21
From 2011/12, the Government's net worth has steadily increased, largely because of gains in asset values, and the OBEGAL has steadily improved. After 2010/11, the gap between expenses and revenue declined each year to 2014/15, when the Government recorded a small OBEGAL surplus ($0.7 billion including the minority interest share) – the first time government revenue had exceeded expenses since 2008. The gradual narrowing of the gap between expenses and revenue was largely driven by increases in tax revenue as the economy improved and some tax policy changes took effect, with the growth in revenue outpacing the growth in government spending. During this period, government borrowing continued to increase to fund the Government's continuing cash deficits.
3.22
The biggest factors affecting the changes in net worth from 2012/13 to 2015/16 were the changes in values of the Government's assets and liabilities. Net worth increased because of the upwards valuations of Government assets (or downward valuation of liabilities). The items that had the most significant effects on net worth in this period were:
- investment gains – primarily in the asset portfolios of ACC and the New Zealand Superannuation Fund;
- fluctuations in the values of the ACC and GSF long-term liabilities, mainly driven by changes in discount rates; and
- upward revaluations of the Government's physical assets.
3.23
In 2013/14, a significant increase in net worth ($3.3 billion) resulted from the Government's share offers in the partial sale of the state-owned energy companies. Although the cash received for the sale of shares increased the Government's asset base, it had no effect on the net worth attributable to the Crown because the $3.3 billion received was reflected instead in the net worth attributable to minority interests.16
3.24
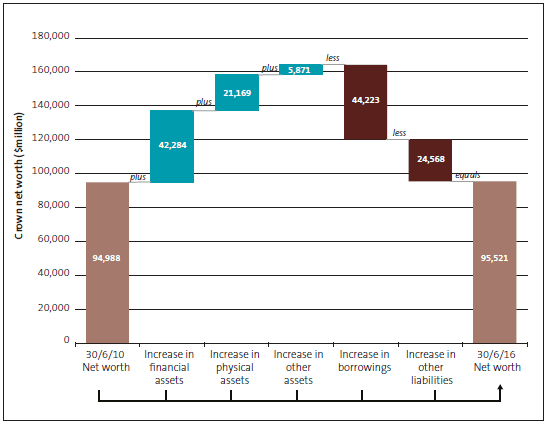
A notable point, shown in Figures 5 and 6, is that the Government's net worth at the end of the period shown ($95.5 billion) is about the same as it was at the beginning of the period ($95.0 billion). Figure 7 presents the net changes in the Government's balance sheet items between 2010 and 2016 and shows that reported assets have increased by $69 billion – and its liabilities have increased by about the same amount.
3.25
Figure 7 shows that the increase in the value of the Government's financial assets has been significantly greater than the increase in physical and other assets during this period. Government borrowing is $44 billion higher in 2016 than in 2010. The increase in borrowings was slightly larger than the increase in the value of financial assets.
Figure 7
Changes in the net worth of the Government between 2010 and 2016
3.26
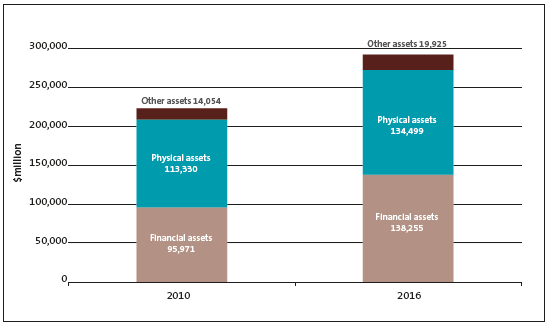
In Figure 8, we look more closely at the Government's asset base – financial assets, physical assets, and other assets. We compare the composition of government assets as at 30 June 2010 with the composition as at 30 June 2016. Figure 8 shows the growth in the value of physical assets on the Government's balance sheet and highlights the even greater growth in the amount and proportion of financial assets.
3.27
A significant proportion of government assets are reported at "fair value" as opposed to what they cost. Fair values are generally based on notions of market values or other economic value, which provide more relevant measures of an asset's worth than the historical cost of the asset.
3.28
Accounting at fair value has a degree of subjectivity. Measuring fair value often requires management judgement about market assumptions, likely future inflation rates, likely future cash flows, and an appropriate rate at which to discount the cash flows.17
Figure 8
Crown asset composition as at 30 June in 2010 and 2016
Physical assets
3.29
The value of physical assets (property, plant, and equipment) reported in the financial statements rose by $21.2 billion (19%) between 2010 and 2016. The increase in this class of assets, as shown in Figure 8, is partly due to increased land values.
3.30
When physical assets such as land are reported at fair value, the upward movement in the market values of those assets are reflected in higher asset values in the Government's balance sheet.
3.31
On the equity side of the balance sheet, the valuation increase is usually reflected in the "property, plant, and equipment revaluation reserve". That revaluation reserve has, over time, become a larger component of the Government's net worth. In 2016, the revaluation reserve makes up 85% of net worth (having peaked at 94% in 2012). Because the revaluation reserve is a more significant part of the Government's balance sheet than it was in the past, the assumptions and judgements that go into reporting physical asset fair values have become more important.
3.32
A significant and constant factor in the rising value of physical assets during this period was the increasing value of the state housing portfolio, driven by rising Auckland property prices.
3.33
Another asset that we have reported on frequently in the past seven years is the state highway network. Upward revaluations of state highway land also contributed to the increases in Government net worth between 2010 and 2016.
3.34
This state highway network valuation is particularly complex and provides different measurement challenges. Challenges relate to identifying and including all of the components that make up the network and estimating their useful lives. We have previously noted that there are uncertainties with the quality of some underlying data used in the valuation, including the quantity, cost, and life of some components. The state highway network has also been identified as a key audit matter in our 2015/16 audit report of the financial statements (see paragraphs 2.18-2.20 and the Appendix).
Financial assets
3.35
Figures 7 and 8 show that the value of financial assets increased by $42.3 billion (a 44% increase) compared with $21.2 billion (19% increase) for physical assets, and $5.8 billion (42% increase) for other assets. The significant increase in financial assets during the period has increased the complexity and volatility of the Government's asset base.
3.36
In the past, the holdings of financial assets were relatively small and usually based on managing short-term cash needs and supporting debt requirements. Today, they are also used to increase liquidity, flexibility, and risk management in the delivery of public services.18
3.37
The larger asset classes in the financial asset portfolio are marketable securities, deposits, and derivatives in gain (39% of financial assets); share investments (18%); and advances (20%). Most financial assets are held by the New Zealand Superannuation Fund, ACC, and the Reserve Bank of New Zealand. Nearly 60% of the value of advances are Kiwibank loans and advances, with student loans making up more than 30%.
3.38
The valuation of securities and share investments is relatively straightforward when their fair values can be determined by reference to observable and objective data, such as quoted market prices. For unlisted shares and securities for which there is no active market, the value arrived at for financial reporting purposes is more subjective because more reliance is placed on assumptions and other judgements (such as cash flow forecasts and the selection of an appropriate discount rate to determine the asset's present value). Similar challenges apply to valuing student loans.
3.39
We reported on public sector financial assets in our 2016 report, A review of public sector financial assets and how they are managed and governed. In our report, we recommended that the financial assets (and associated liabilities) of central government should be considered together, with a clear understanding of the risks being taken, how they are managed, and the opportunities and challenges they create. This is especially so since the Treasury's projections suggest that financial assets will increasingly dominate the Government's balance sheet.
Long-term liabilities
3.40
Significant judgements apply not only to establishing the reported value of government assets but also to the reported value of its long-term liabilities.
3.41
Measuring and reporting on the Government's long-term liabilities also involves testing assumptions about the amount and timing of cash flows, projected inflation rates, and the calculation of risk-free discount rates. Actuarial expertise is relied on for much of this work.
3.42
Several entities whose accounts are consolidated into the financial statements use discounted cash flow models to value various assets and liabilities. Before 2009, different entities whose component financial elements are included in the financial statements used different risk-free rates and Consumer Price Index assumptions to calculate their respective liabilities. During 2010, the Treasury completed a substantial project to establish an acceptable methodology for deriving risk-free discount rates and inflation assumptions for use in certain accounting valuations for the financial statements.
3.43
The effect of changes in the risk-free rate or Consumer Price Index assumptions on the financial statements is significant. For example, a 1% increase in the risk-free discount rate would decrease the ACC claims obligation by $5.2 billion, or the obligation would increase by $6.9 billion should the rate decrease by 1%.
3.44
As auditors, we need to satisfy ourselves that appropriate risk-free discount rates and Consumer Price Index assumptions have been used in the valuation models. This is especially important for the Crown's two significant long-term liabilities, which can be significantly affected by changes in discount rates – ACC's outstanding claims liability (which constitutes 20% of the Government's total liabilities) and the retirement plan obligations for the members of the GSF (which constitutes about 6% of the Government's total liabilities).
3.45
Fluctuations in the values of the ACC and GSF liabilities, mainly because of changes to discount rates, have significantly affected movements in the Government's net worth during the seven years discussed in this Part.
3.46
Upward fluctuations (actuarial gains), including for ACC, helped offset negative OBEGAL results in 2010/11 and 2012/13. However, in 2011/12 actuarial losses of about $6.8 billion for these liabilities added significantly to a negative OBEGAL of $9.2 billion. And in 2015/16, ACC and GSF actuarial losses of over $7 billion more than offset the small OBEGAL surplus. The Government's net worth increased in 2015/16 nonetheless because the resulting negative operating balance (that is, OBEGAL minus losses) was more than offset by revaluation gains on physical assets.
3.47
Estimating and valuing liabilities stemming from the Canterbury earthquakes has also posed major challenges for the Government; accounting for the effects of, and responses to, the Canterbury earthquakes has featured in our audit reports on the financial statements since 2010/11.
3.48
After the September 2010 earthquake, the 2009/10 financial statements included a "subsequent event" note about the earthquake. We concluded that the event did not require the financial statements to be adjusted (that is, it was a "non-adjusting event") but that the costs would be significant.19
3.49
A year later, the combined effect of the September 2010 and February 2011 events was a significant matter for the financial statements. With net costs of $9.1 billion, the earthquakes affected both the preparation and the audit of the financial statements. A separate note on the Canterbury earthquakes has been included in each set of financial statements since 2011.
3.50
Matters stemming from the earthquakes that needed careful consideration from 2011 to 2016 included:
- quantifying the Earthquake Commission's insurance liabilities and expenses;
- the effect of acquiring the Canterbury-related business of AMI and managing its earthquake liabilities through the Crown-owned company, Southern Response Earthquake Services Limited;
- accounting for red zone properties by CERA; and
- the Government's share of the cost of restoring local authority infrastructure in the region.
3.51
In the absence of historical data or experience, the inherent uncertainties in the estimates and underlying assumptions about the various asset and liability balances presented many challenges for the public entities affected. Entities and their auditors needed to use experts, such as actuaries and engineers, to test entities' assumptions and judgements about the values, and changes in values, of balance sheet items. Specifically, this included assessing the number and amount of outstanding claims, estimating the time expected to repair or rebuild, and making judgements about the effect of inflation on future costs.
3.52
We worked with the Treasury and the separate government entities to better understand the assumptions and related sensitivities for the financial figures and to agree the accounting treatment for various transactions. Our work with the Treasury also included ensuring that entities made adequate annual report disclosures about the costs and associated liabilities arising from the earthquake events.
3.53
We have given special attention in our audits to the outstanding insurance liability. Although the size of the liability has decreased, the level of uncertainty about the amount remains high, particularly for Earthquake Commission claims where there has been severe land damage. We have included the outstanding earthquake liabilities in our key audit matters for 2015/16 because of the continuing public interest in these liabilities (see paragraphs 2.39-2.41).
3.54
Another audit matter that has featured regularly in our reports in the past seven years concerns the long-term liability associated with Treaty of Waitangi settlements. The Treaty settlements affect several balances in the financial statements. For financial reporting purposes, considerable judgement is required in recognising obligations to iwi, payments due to Waikato Tainui and Ngāi Tahu triggered by the relativity mechanism clause, and related disputed items.
Audit opinions during the last seven years
3.55
We have been able to issue unmodified audit opinions on the Government's financial statements for each of the seven years discussed in this Part.
3.56
We have issued "standard" audit reports for five of the seven years. The exceptions were 2010/11 and 2011/12, for which we included an "emphasis of matter" in those audit reports to draw readers' attention to uncertainties in the financial statements arising from the Canterbury earthquakes.
3.57
Without needing to modify our audit opinion, we pointed out that there were significant uncertainties underpinning estimates in the Government's financial statements about the Earthquake Commission, the AMI/Southern Response Earthquake Services Limited support package, the Canterbury residential red zone support package, and the Government's share of local authority costs in response to the earthquakes and its share for restoring local authority water infrastructure damaged by the earthquakes.
9: We have published several reports on managing government assets. See Insuring public assets (June 2013), New Zealand Transport Agency: Maintaining and renewing the state highway network – follow-up report (October 2014), Governance and accountability for three Christchurch rebuild projects (December 2015), District health boards' response to asset management requirements since 2009 (June 2016), and A review of public sector financial assets and how they are managed and governed (March 2016). All of these reports are available at oag.govt.nz.
10: We also recently published a separate report, mproving financial reporting in the public sector (February 2016), in which we reported positive changes to accounting standards in the last six to seven years. We expect those changes to lead to improvements in financial reporting.
11: Total tax revenue comprises individual and corporate income tax, GST, and other indirect taxes.
12: Non-tax revenue includes fees, levies, revenue from operations, and interest and dividends received.
13: Report of the Controller and Auditor-General on the Audit of the Crown and Government Departments for the year ended 30 June 1992, pages 25, 27, and 50.
14: The Treasury (2016), Financial Statements of the Government of New Zealand for the Year Ended 30 June 2016, Wellington, page 18.
15: The ACC and GSF liabilities increased as a result of "actuarial losses" caused by the decrease in interest rates. The decrease in interest rates led to a decrease in the discount rate, which increases the present value of the future payments obligations (that is, the long-term liabilities).
16: Minority interests is the portion of the Government's net worth attributable to the minority shareholders in the Crown-owned, listed companies, which mainly comprise Mercury NZ Limited (formerly Mighty River Power Limited), Meridian Energy Limited, Genesis Energy Limited, and Air New Zealand Limited.
17: Future cash flows need to be discounted to arrive at their present value.
18: We discuss this in our 2016 report, A review of public sector financial assets and how they are managed and governed. Available at oag.govt.nz.
19: The Treasury (2016), Financial Statements of the Government of New Zealand for the Year Ended 30 June 2010, Wellington, page 153. Available at www.treasury.govt.nz.

