Part 3: Analysing the audited financial statements
3.1
In this Part, we discuss what the audited financial statements can tell us about the financial health of the companies.
3.2
This is the first time we have published analytical results about risk and return for the companies. In this Part, we consider:
- the overall size of the SOEs and listed companies portfolio;
- the returns made on that portfolio; and
- some aspects of the risks that the companies face in generating their returns.
3.3
Analysis of financial statements can produce "indicators" that should prompt further questions. This analysis does not provide a definitive judgement on the companies' financial health and their vulnerability to uncertainty. However, if used carefully and as a prompt for further testing and inquiry, annual reports can provide early warning of potential financial difficulty.
3.4
The companies operate in a wide range of disparate industries. This limits the comparability of financial indicators between the companies.6 Companies may also adopt different accounting policies, which may mean that the companies measure and report some items differently. This also limits the comparability of results and other indicators.
3.5
Bearing this limited comparability in mind, our analysis places a few companies at the riskier end of several risk indicators. This suggests that they might warrant attention. Our analysis highlights the financial difficulty of two companies in particular – Learning Media and Solid Energy. Our analysis also suggests that a closer look should be taken at the liquidity situation for about half of the companies.
3.6
There are many ways to analyse company financial statements. The Treasury, through its Commercial Operations unit (formerly the Crown Ownership Monitoring Unit – COMU), produces an annual portfolio report. In our view, the annual portfolio reports are a valuable resource for anyone wishing to examine the companies' performance.7 The annual portfolio reports use a different and wider set of indicators than we do in this Part. They draw financial data from internal government sources. We have based most of our analysis on the numbers available to Parliament and the public through the audited financial statements of the companies.
Group and parent financial statements
3.7
For our analysis of the size of the SOEs and listed companies portfolio, we used the group financial results reported in the Financial Statements of the Government. This is because the group financial statements provide a better picture of the total resources owned by the Government and the total income earned. In the Financial Statements of the Government, KiwiRail Holdings and New Zealand Railways Corporation are reported as separate companies.
3.8
For our analysis of individual companies' performance and risk, we used the financial statements of the parent company in most instances. This allows our analysis to focus on, in most instances, the one dominant business.
3.9
Although our analysis of individual companies focused on the parent company's financial statements, we made exceptions for KiwiRail and Kordia. Because KiwiRail was split into KiwiRail Holdings and New Zealand Railways Corporation during 2012/13, we have used the combined group financial statements for comparability between years (KiwiRail Group). These financial statements show what the financial results would have been for the group if the two companies had remained combined for 2012/13. Accordingly, these financial statements have not been audited. We have also used the group results for Kordia because all its business operations are carried out through its subsidiaries.
3.10
It should be noted that financial indicators, including financial ratios, derived from the parent company's financial statements might differ significantly from those derived from group financial statements.
The size of the portfolio
3.11
As at 30 June 2013, total shareholder equity in the companies on a group basis was $20.2 billion. The companies managed assets of $52.5 billion (book value) and generated revenue of $16.37 billion.8
3.12
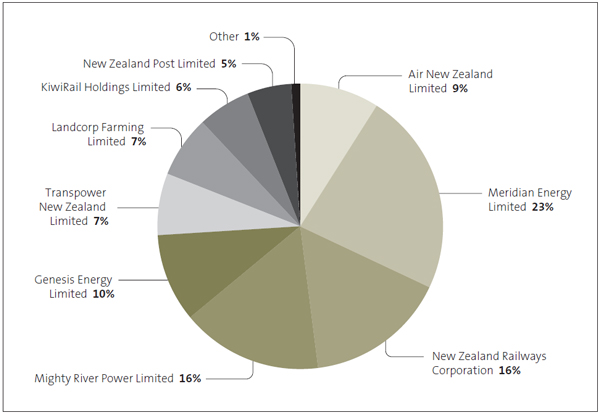
Figure 5 shows the proportionate sizes of the companies (on a group basis) by shareholder equity. The largest companies by shareholder equity are:
- Meridian Energy Limited (23% of the portfolio);
- New Zealand Railways Corporation (16%);
- Mighty River Power Limited (16%);
- Genesis Energy Limited (10%); and
- Air New Zealand Limited (9%).
3.13
Together, these five companies account for 74% of the SOEs and listed companies portfolio by equity. As at 30 June 2013, the Crown owned 55.01% of the shares in Mighty River Power and 72.85% of the shares in Air New Zealand.9
Figure 5
Companies by shareholder equity, as at 30 June 2013
3.14
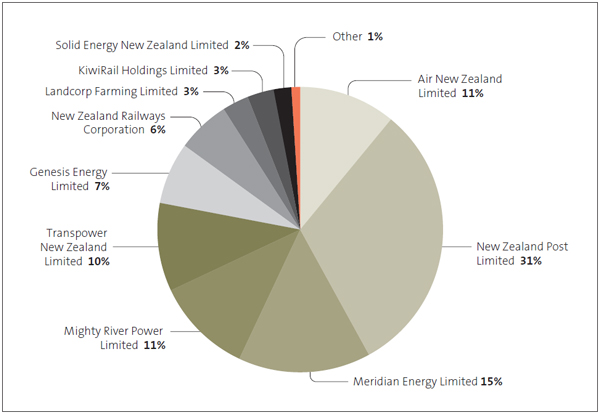
Figure 6 shows the largest companies by total assets. The five largest companies (on a group basis) by total assets are:
- New Zealand Post (31%);
- Meridian Energy (15%);
- Mighty River Power (11%);
- Air New Zealand (11%); and
- Transpower New Zealand Limited (10%).
3.15
Together, these five companies make up 78% of the total assets (by book value). Although New Zealand Post represents only 5% of the portfolio by equity, it holds 31% of the total assets. Kiwibank's banking assets make up more than 90% of New Zealand Post's total assets.10
Figure 6
Companies by total assets, as at 30 June 2013
3.16
Four of the five largest companies by total assets are also the biggest revenue earners. Air New Zealand, Meridian Energy, New Zealand Post, Genesis Energy, and Mighty River Power accounted for 79% of the revenue that this portfolio of companies generated in 2012/13. Together, the companies employed more than 32,000 full-time equivalent staff in 2012/13.11
Return on investment
Portfolio return
3.17
Figure 7 shows the overall revenue of the companies for each of the years from 2008/09 to 2012/13. The results are presented on a group basis. The overall revenue of companies in 2012/13 was $16.37 billion (down from $16.42 billion in 2011/12). Between 2008/09 and 2012/13, the yearly revenue these companies generated increased by 10%.
Figure 7
Overall revenue, 2008/09 to 2012/13
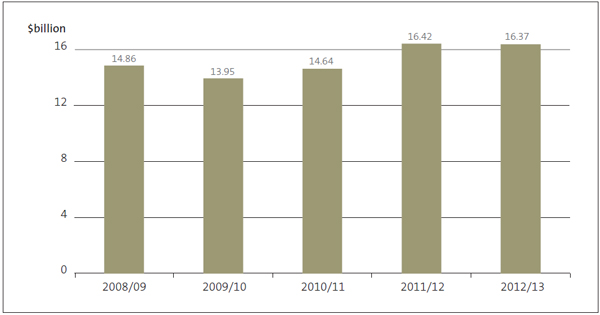
Source: The Financial Statements of the Government. Note: Revenue excludes gains. The results present gross revenue and return. They include both the Government's share and the minority interest share. Inter-company transactions and balances are eliminated on consolidation.
3.18
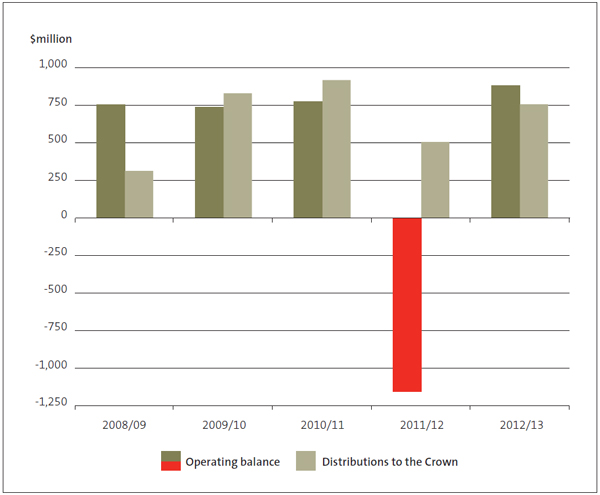
Operating balance is a measure of profitability (similar to net profit). It is operating revenue less operating expenses, which includes gains and losses reported as part of comprehensive income.12 Figure 8 shows that the total of the companies' operating balances has fluctuated between 2008/09 and 2012/13. The decline in 2011/12 is almost entirely the result of the write-down of the New Zealand Railway Corporation's rail assets before they were transferred to KiwiRail Holdings. Considering movement over the medium term, the operating balance for 2012/13 was 17% higher than that for 2008/09.
Figure 8
Operating balance and distributions to the Crown, 2008/09 to 2012/13
3.19
The profit that the companies returned to the Crown in the form of dividends totalled $757 million in 2012/13. This was more than the $314 million returned in 2008/09, but less than the $918 million returned in 2010/11 (see Appendix 2).
3.20
In 2012/13, the companies generated a return on total assets13 of 1.7% and a return on total equity14 of 4.4%. The Treasury states that overall performance of Crown-owned companies has been modest and, with some notable exceptions, mediocre.15
3.21
When adjusted for the minority interest investment in Air New Zealand and Mighty River Power, the amount distributed in the form of dividends to the Crown in 2012/13 was 4.1% of the Crown's equity interest.
Returns from individual companies
3.22
From this point on, our analysis is mainly derived from the parent company's financial statements (except for Kordia and the combined accounts of New Zealand Railways Corporation and KiwiRail Holdings, as explained in paragraph 3.9).
3.23
Common measures of return, profitability, or operating efficiency include:
- return on equity;
- return on capital employed;
- return on total assets;
- earnings per share;
- dividend per share or dividend yield;
- total shareholder return; and
- operating margin – a net income-to-revenue measure, often characterised as the percentage of earnings before interest, tax, depreciation, amortisation, and fair value adjustments (EBITDAF) to revenue.
3.24
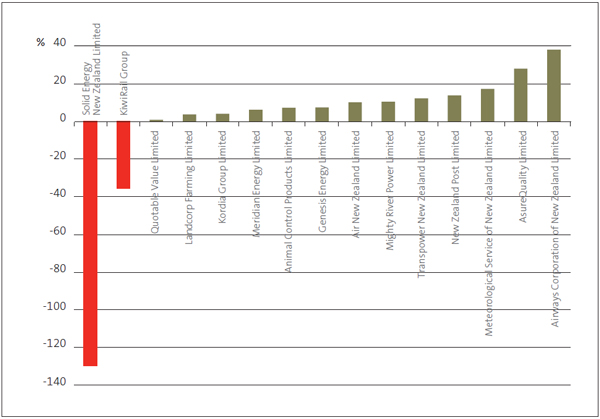
Figure 9 shows the return on equity for 15 companies for 2012/13.16 These figures are based on the disclosures in each company's annual report (unlike the "portfolio return" discussed in paragraphs 3.17 to 3.21, which is based on the consolidated results in the Financial Statements of the Government). We have excluded Electricity Corporation because it is winding up its operations and Learning Media because it had negative equity at 30 June 2013.
Figure 9
Return on equity, 2012/13
3.25
As a performance indicator, return on equity takes an investor perspective. It provides an indicator of the profit (or return) the investor makes on their investment dollar. In 2012/13, the companies with higher reported ratios were Airways Corporation of New Zealand Limited, AsureQuality Limited, Meteorological Service of New Zealand Limited (Met Service), New Zealand Post, and Transpower.
3.26
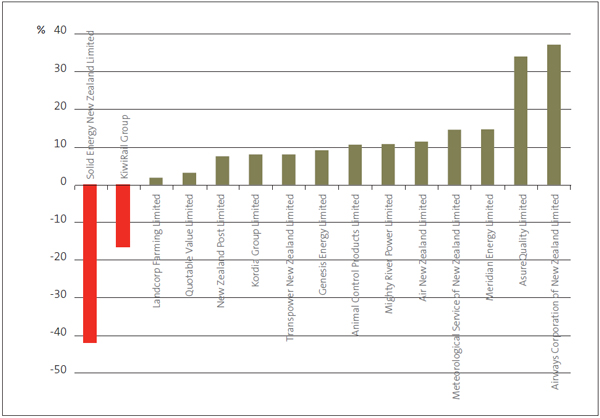
Return on capital employed is also a profitability indicator. It measures how much profit the company generates from all of the financial capital at its disposal (its debt funding as well as its shareholder equity funding). Figure 10 shows that Airways Corporation and AsureQuality lead this indicator, with Meridian Energy, Met Service, and Air New Zealand in the next three places.
Figure 10
Return on capital employed, 2012/13
3.27
Short-term measures, such as for one financial year, show a small part of the picture. The companies represent long-term investments. As such, a better picture will always be gained by looking at the data for each company over time, as well as a range of operating performance measures.
3.28
We recommend reading the Treasury's annual portfolio reports, which report many measures of company return, profitability, and efficiency.
3.29
Another important part of looking at the profitability of these companies is to look at the portfolio as a whole, which is best done by looking at the Financial Statements of the Government (see paragraphs 3.17 to 3.21). The diversity of the companies can help to reduce the Government's investment risk.
3.30
The remainder of this Part considers some of the risks the companies face in generating their returns, as well as related risk indicators.
Indicators of ability to operate as planned or forecast
3.31
One aspect of a company's performance is the volatility of the commercial environment each company operates in and how well it can manage earnings within that environment. Comparing forecast performance with actual performance is one way of measuring volatility or the stability of earnings. A large difference between forecast and actual performance could reflect management's ability to manage, its budgeting skills, its forecasting ability, or an unpredictable business environment in which accurate forecasts cannot reasonably be expected.
3.32
Many measures can be used to indicate a company's ability to operate as planned. We have chosen one measure – the variance in return on equity. Other possible measures include budget versus actual variances for:
- revenue;
- expenses;
- earnings before interest, tax, depreciation, and amortisation;
- net profit after tax;
- return on capital employed; and
- the ratio of operating cash flow to total cash flow.
3.33
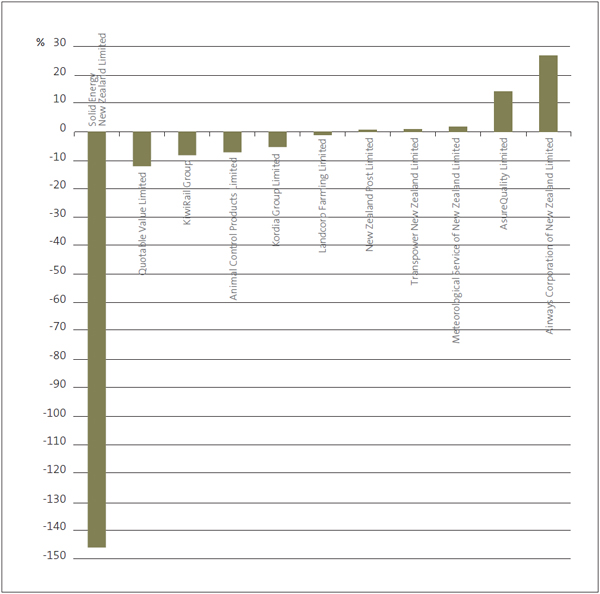
The companies do not publish forecast revenue, expenses, or net earnings variants in their annual reports. However, many report return on equity as a key financial performance indicator. We have been able to obtain target and actual return on equity data from the statements of corporate intent and annual reports of 11 of the 18 companies. We compare target and actual return on equity for those companies in Appendix 2. Figure 11 shows the percentage point variances between target and actual return on equity for the 11 companies.
Figure 11
Percentage point variance between target and actual return on equity, 2012/13
3.34
Figure 11 shows that, even with a relatively small set of 11 companies, there is a wide range of variance between the return on equity forecast for the year and the return on equity achieved. Four companies came within 5 percentage points of their forecast target (Landcorp Farming Limited, New Zealand Post, Transpower, and Met Service). The results of four companies (Solid Energy, Quotable Value Limited, AsureQuality, and Airways Corporation) were more than 10 percentage points away from their forecast target.
3.35
Solid Energy's financial performance reflects a weakened global coal market. As a result, the company has refocused on its core coal mining capability. It has divested operations and assets that are surplus to requirements. This has resulted in substantial impairment to the company's assets, and the company's equity has decreased significantly. The company never envisaged this amount of impairment, nor the sustained and low price of export coal.
3.36
Goodwill impairments, one-off costs and losses, weather disruptions, drought, the performances of major customers, a significant decline in demand, and the loss on sale of a significant subsidiary also contributed to the negative variances shown in Figure 11.17
3.37
Factors contributing to positive variances include shifting to higher-margin business, improved productivity, lower-than-forecast costs, increased volumes, and a one-off event (early termination of a lease).18
3.38
Many factors can contribute to variances between companies' targeted and actual performance. Also, the variances for one financial year provide a limited picture. The companies' variances during the last five years provide a better picture of whether there are persistent or intermittent variances between forecast/target and actual performance.
3.39
We reviewed variances for 10 companies for the last five years. For five of these 10 companies, the average variance was more than 5 percentage points. We also observed that the variance for one year in isolation is often not typical of the variances over the medium term.
3.40
However, large variances should prompt the question of whether it is reasonable to expect management to have predicted the factors influencing results.
Indicators of liquidity and the ability to manage uncertainty
3.41
We analyse liquidity and solvency to assess how well a public entity can settle its debts and obligations immediately (liquidity) and over the longer term (solvency). Having enough liquid assets (cash or assets that can be easily and quickly converted to cash) is necessary for day-to-day operations and is important in times of uncertainty.
3.42
For the companies, factors such as how dominant the entity is in the marketplace (strong competition or a near-monopoly) and the extent to which its services are essential (certainty of demand) contribute to exposure to liquidity or solvency risks.
3.43
Many measures of liquidity have been used to assess how vulnerable a company is to short-to-medium-term disruptions to the flow of "working capital". These measures include the cash ratio, quick ratio, liquid or acid test ratio, and the current (or working capital) ratio.
3.44
The current ratio (or working capital ratio) states the value of current assets in relation to the value of current liabilities. It can be expressed as a true ratio (for example, 1.5:1) or as current assets divided by current liabilities (1.5 or 150%). Using current assets over current liabilities, a current ratio of more than 1 suggests that a company will be able to pay its immediate creditors. This presumes that non-cash current assets (such as debtors) can be quickly and easily converted into cash. Because of uncertainties about the ability to quickly liquidate assets, a ratio higher than 1 is usually preferable.
3.45
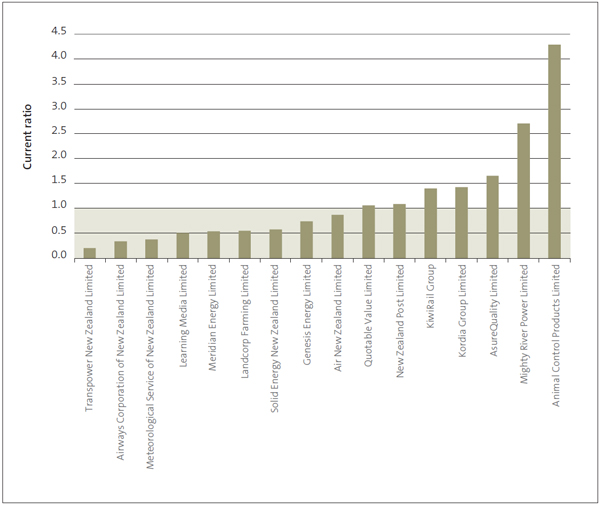
Figure 12 shows the current ratios as at 30 June 2013 for the 16 companies that operated during 2012/13.19 We have excluded Electricity Corporation and included the combined results for KiwiRail Holdings and New Zealand Railways Corporation as KiwiRail Group.
Figure 12
Current ratios, as at 30 June 2013
Note: Current ratios are current assets divided by current liabilities.
3.46
For seven of these companies, current assets exceeded current liabilities at 30 June 2013 (they had a current ratio greater than 1:1). Current assets exceeded current liabilities for Quotable Value, New Zealand Post, KiwiRail Group, Kordia Group, and AsureQuality. At the higher end, current assets exceeded current liabilities by more than 2:1 for Mighty River Power and Animal Control Products Limited. Current liabilities exceeded current assets for Transpower, Airways Corporation, Met Service, Learning Media, Meridian Energy, Landcorp, Solid Energy, Genesis Energy, and Air New Zealand.
3.47
There are some limitations with the current ratio, mainly because current assets and current liabilities are defined as rights and obligations that are expected to materialise within the year. Indicators of a more immediate ability to settle debt include ratios of only the most liquid of assets (cash or cash equivalents) to current liabilities.
3.48
Working capital can be improved significantly by tighter debtor and creditor management – collecting money from debtors sooner and delaying payment to creditors. However, we expect government-owned entities to pay their creditors within a reasonable time.
3.49
Using a range of financial indicators can help readers of financial statements to work out whether a company might be unable to manage its cash flows. To this end, another common measure is the interest cover ratio. This compares earnings generated with the cost of borrowing to indicate how well a company can service loan funding. The conventional measure of interest cover is earnings before interest and tax over interest expense (or EBITDAF over interest expense), derived from figures in the income statement.
3.50
An alternative approach is to use cash-flow statement figures to compare net operating cash inflow to interest payments. A cash-based measure of interest costs considers not only the interest that is offset against revenue in the income statement (that is, "expensed" interest) but also interest that is added to the cost of fixed assets (that is, "capitalised" interest). Figure 13 shows the cash-based interest cover indicators for the companies for 2012/13.
Figure 13
Interest cover, 2012/13
| Company | Interest cover (based on cash flow) |
|---|---|
| Animal Control Products Limited | 377.3 |
| Quotable Value Limited | 21.8 |
| AsureQuality Limited | 17.9 |
| Airways Corporation of New Zealand Limited | 11.4 |
| Air New Zealand Limited | 10.5 |
| Meridian Energy Limited | 6.2 |
| KiwiRail Group | 6.1 |
| Genesis Energy Limited | 3.9 |
| Mighty River Power Limited | 3.7 |
| Transpower New Zealand Limited | 2.8 |
| New Zealand Post Limited | 2.7 |
| Landcorp Farming Limited | 2.3 |
| Kordia Group Limited | 1.2 |
| Solid Energy New Zealand Limited | 0.3 |
| Meteorological Service of New Zealand Limited | (3.9) |
| Learning Media Limited | (17.5) |
Note: Interest cover is net operating cash flow before interest payments divided by interest payments.
3.51
Figure 13 shows negative interest cover for Learning Media and Met Service because both companies reported negative operating cash flow for 2012/13. Solid Energy's net operating cash flow before deducting interest payments, although positive, was about one-third of the interest payments, resulting in an interest cover of 0.3. Kordia's interest cover is 1.2.
3.52
If we apply the more conventional approach of basing interest cover on the income statement, we find that Met Service's interest cover ratio is 11.9. This means that earnings before interest expense covers the interest expense 11.9 times.20 For Kordia, this approach results in an interest cover indicator of 7.6.21
3.53
It is clear that interest cover indicators based on cash flow can differ widely from those derived from the income statement. This shows the desirability of considering a range of approaches to deriving risk indicators.
3.54
Learning Media (now wound up) and Solid Energy (experiencing financial difficulty) scored at the lower end of the range on both of our measures of liquidity and the ability to manage uncertainty.
Indicators of leverage, solvency, and the ability to invest for the future
3.55
Gearing and leverage ratios indicate a company's ability to service its debt in the long term. Gearing and leverage measures come in various forms. However, all involve the relationship of shareholder equity (funds owned through shareholding) to liabilities (funds owed to others). They are useful for providing benchmarks of the desired balance between shareholder equity and debt finance.
3.56
If leverage is too high, a company can risk breaching its debt covenants with banks and other suppliers of funds. This could restrict future borrowings and affect the company's ability to invest for the future. High leverage can also provide an early warning of possible liquidity problems – the company might have trouble servicing high borrowing costs as leverage increases.
3.57
In Figure 14, we present one indicator of leverage for the companies. The indicator we have derived from the annual reports is the relationship of total liabilities to total assets.
Figure 14
Leverage of companies, as at 30 June 2013
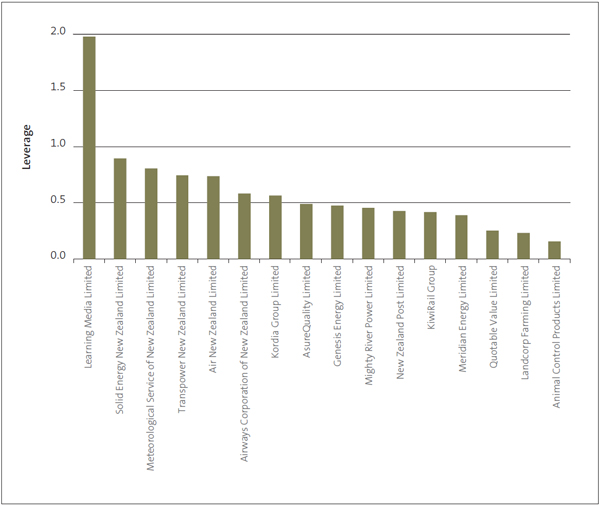
Note: A leverage of 1.0 means that total liabilities equal total assets. A leverage of 0.75 equates to a debt/equity ratio of 3:1, meaning that total assets are funded by $3 of debt to every $1 of shareholder equity. See Appendix 2 for data.
3.58
We expect leverage ratios to differ by industry. Therefore, it is difficult to conclude whether a company's leverage is appropriate without an industry context. The obvious observation from Figure 14 is Learning Media's extreme leverage situation at 30 June 2013, reflecting negative equity. Others at the high end are Solid Energy (90%) and Met Service (81%). The leverage of all the other companies appears to be within normal commercial bounds.
3.59
When we consider a company's ability to invest in the future, we are also interested in how well it can maintain and replace productive assets. We expect the companies to have comprehensive and robust asset management plans that help to ensure that their long-term productive assets are maintained and replaced so as to provide continuity of service. It is difficult to draw inferences about this aspect of performance by looking at numbers alone. However, there are several approaches to analysing annual report data that, like many of the indicators already discussed, might prompt further investigation.
3.60
As a starting point, a useful indicator of a company's ability to invest for the future is the relationship between retained earnings and total shareholders' equity or retained earnings and total assets. Companies are generally expected to replace fixed assets from their own funds as part of their financial strategy and therefore need to retain a certain amount of their earnings. Although these ratios do not directly measure whether companies have enough funds to replace fixed assets, the ratios might indirectly reflect the movement in the relationship between available funds and accumulated depreciation (which approximates the value of assets needing to be replaced). An alternative financial strategy to replacing assets from retained earnings could be, of course, to borrow or raise more equity capital.
3.61
More generally, retained earnings to equity and retained earnings to total assets can indicate whether the companies will be able to re-invest from their own resources in the future. Observing how these indicators move over the medium term can indicate whether the company's balance sheet is getting stronger or weaker.
3.62
Figure 15 shows the companies' ratio of retained earnings to equity for the seven years from 2006/07 to 2012/13.
3.63
Figure 16 shows the ratio of retained earnings to total assets for the same time period.
Figure 15
Retained earnings to total shareholders' equity, 2006/07 to 2012/13
| 2006/07 | 2007/08 | 2008/09 | 2009/10 | 2010/11 | 2011/12 | 2012/13 | |
|---|---|---|---|---|---|---|---|
| Air New Zealand Limited | (3.11) | (2.30) | (3.11) | (4.68) | (3.12) | (1.61) | (0.97) |
| Airways Corporation of New Zealand Limited | 0.11 | 0.19 | 0.17 | 0.03 | 0.01 | 0.01 | 0.30 |
| Animal Control Products Limited | 0.64 | 0.68 | 0.71 | 0.69 | 0.72 | 0.71 | 0.70 |
| AsureQuality Limited | 0.06 | 0.06 | 0.14 | 0.17 | 0.24 | 0.22 | 0.27 |
| KiwiRail Group | 0.03 | 0.04 | 0.06 | 0.09 | 0.11 | (0.22) | 0.75 |
| Genesis Energy Limited | 0.39 | 0.43 | 0.29 | 0.30 | 0.24 | 0.28 | 0.27 |
| Kordia Group Limited | 0.19 | 0.12 | 0.12 | 0.11 | (0.06) | 0.07 | 0.09 |
| Landcorp Farming Limited | 0.12 | 0.16 | 0.18 | 0.18 | 0.18 | 0.19 | 0.18 |
| Learning Media Limited | 0.79 | 0.52 | 0.70 | 0.78 | 0.80 | 0.74 | 1.27* |
| Meridian Energy Limited | (0.02) | (0.04) | (0.02) | (0.04) | (0.03) | (0.05) | (0.02) |
| Meteorological Service of New Zealand Limited | (0.07) | 0.21 | (1.31) | (4.53) | (1.37) | 0.19 | 0.13 |
| Mighty River Power Limited | 0.34 | 0.29 | 0.31 | 0.24 | 0.22 | 0.20 | 0.22 |
| New Zealand Post Limited | 0.56 | 0.56 | 0.74 | 0.74 | 0.73 | 0.74 | 0.75 |
| Quotable Value Limited | 0.54 | 0.79 | 0.79 | 0.78 | 0.79 | 0.81 | 0.77 |
| Solid Energy New Zealand Limited | 0.79 | 0.82 | 0.82 | 0.84 | 0.84 | 0.86 | 0.34 |
| Transpower New Zealand Limited | (0.34) | (0.30) | (0.21) | 0.15 | 0.21 | 0.24 | 0.15 |
* Learning Media reported negative retained earnings and negative shareholders' equity, which resulted in a positive ratio.
Figure 16
Retained earnings to total assets, 2006/07 to 2012/13
| 2006/07 | 2007/08 | 2008/09 | 2009/10 | 2010/11 | 2011/12 | 2012/13 | |
|---|---|---|---|---|---|---|---|
| Air New Zealand Limited | (0.46) | (0.39) | (0.43) | (0.51) | (0.42) | (0.31) | (0.25) |
| Airways Corporation of New Zealand Limited | 0.03 | 0.07 | 0.06 | 0.01 | 0.00 | 0.00 | 0.13 |
| Animal Control Products Limited | 0.54 | 0.55 | 0.57 | 0.54 | 0.54 | 0.58 | 0.60 |
| AsureQuality Limited | 0.02 | 0.03 | 0.08 | 0.09 | 0.13 | 0.11 | 0.14 |
| KiwiRail Group | 0.03 | 0.03 | 0.06 | 0.09 | 0.10 | (0.18) | 0.44 |
| Genesis Energy Limited | 0.23 | 0.23 | 0.16 | 0.17 | 0.11 | 0.14 | 0.14 |
| Kordia Group Limited | 0.09 | 0.05 | 0.04 | 0.04 | (0.02) | 0.03 | 0.04 |
| Landcorp Farming Limited | 0.10 | 0.13 | 0.15 | 0.15 | 0.15 | 0.15 | 0.14 |
| Learning Media Limited | 0.26 | 0.19 | 0.24 | 0.34 | 0.32 | 0.27 | (1.24) |
| Meridian Energy Limited | (0.01) | (0.02) | (0.01) | (0.02) | (0.02) | (0.03) | (0.01) |
| Meteorological Service of New Zealand Limited | (0.02) | 0.08 | (0.14) | (0.17) | (0.10) | 0.04 | 0.02 |
| Mighty River Power Limited | 0.20 | 0.16 | 0.19 | 0.13 | 0.12 | 0.10 | 0.12 |
| New Zealand Post Limited | 0.35 | 0.34 | 0.47 | 0.48 | 0.46 | 0.41 | 0.43 |
| Quotable Value Limited | 0.31 | 0.57 | 0.57 | 0.60 | 0.65 | 0.65 | 0.57 |
| Solid Energy New Zealand Limited | 0.45 | 0.44 | 0.44 | 0.37 | 0.38 | 0.30 | 0.04 |
| Transpower New Zealand Limited | (0.07) | (0.08) | (0.05) | 0.05 | 0.08 | 0.08 | 0.04 |
3.64
A declining ratio might indicate that a company is distributing more of its earnings to shareholders rather than reinvesting. However, a high ratio might indicate that the company is retaining too much. Either way, retained earnings to equity or total asset ratios will differ by industry and are best compared with industry norms.
3.65
AsureQuality has been retaining a steadily increasing proportion of its earnings during the past seven years. New Zealand Post's retained earnings ratios have fluctuated while increasing over the medium term. Kordia and Mighty River Power retained a decreasing proportion of earnings during the period, before a slight upturn in 2012/13. The negative numbers in Air New Zealand's indicators reflect negative retained earnings (also known as a "retained deficit"), which are the result of historical accumulated losses for the parent company. Despite the retained deficit, Air New Zealand's total equity position is positive because the shareholders' capital more than covers the negative retained earnings. Air New Zealand's retained earnings as a proportion of shareholders' equity and total assets have improved between 2010/11 and 2012/13.
3.66
The big picture that can be drawn from Figures 15 and 16 is interesting: although the ratios for individual companies fluctuated during the seven years, there is a general trend for the portfolio as a whole. When we compare the ratios for 2006/07 with those for 2012/13, we find that the retained earnings ratios improved for almost every company during those seven years.
Summary of our conclusions
3.67
The financial statements within audited annual reports provide information on the past performance of companies. With few exceptions, it is unlikely that clear and unequivocal conclusions about the risks to future performance can be drawn with a high degree of certainty from a handful of ratios based on annual report information. However, financial statement analysis is a valuable starting point. The indicators it produces can provide early warning of potential financial difficulty or, at least, be used to prompt further questions.
3.68
The companies operate in a wide range of disparate industries. They may also adopt different accounting policies, leading to different measurement or reporting bases. This needs to be taken into account when comparing the indicators.
3.69
The overall return generated from the SOEs and listed companies portfolio, at 1.7% return on assets and 4.4% return on equity, appears to be low. This accords with the Treasury's view that the performance of Crown-owned companies has been modest.
3.70
Large variances between forecast and actual performance are prompts for questions about management's ability to predict and/or manage performance. In 2012/13, only a minority of companies came within 5 percentage points of their forecast return on equity. Taking a longer-term average, only about half of the companies reported a variance of less than 5 percentage points.
3.71
The ability to manage uncertainty and withstand unfavourable economic conditions in the short term often rests on having enough working capital to pay short-term debts when they fall due. The current ratio (or working capital ratio) shows that more than half of the companies reported current liabilities greater than current assets. Although this indicator does not provide evidence of financial difficulty, it suggests that a closer look should be taken at the companies concerned. When we considered the current ratios with the interest cover indicators based on cash flow, Learning Media, Met Service, and Solid Energy stood out as being at the risky end of the scale. This indicator showed that all of the other companies appeared to have enough interest cover.
3.72
To indicate the longer-term sustainability of the companies, we looked at leverage – that is, the extent to which companies' assets were funded by borrowing (as opposed to shareholder equity). We also looked at the companies' ability to reinvest in assets out of retained earnings. Although we expect leverage to differ by industry, Learning Media, Solid Energy, and Met Service clearly have high leverage. Throughout the portfolio, the level of retained earnings as a proportion of assets and equity has improved over the medium term.
6: For example, the "normal" range for a financial ratio often differs by industry group.
7: Annual portfolio reports are available at www.treasury.govt.nz.
8: Financial Statements of the Government of New Zealand for the Year Ended 30 June 2013, pages 178-179.
9: Financial Statements of the Government of New Zealand for the Year Ended 30 June 2013, page 177.
10: New Zealand Post Group (2014), Annual Review – Supporting Information 2013, page 8.
11: The data on full-time equivalent staff come from Crown Ownership Monitoring Unit, 2013 Annual Portfolio Report, page 102, except for the New Zealand Post data, which come from New Zealand Post, Annual Review 2013, page 17.
12: Financial Statements of the Government of New Zealand for the Year Ended 30 June 2013, page 183. Comprehensive income is operating balance plus valuation gains and losses on assets and liabilities.
13: Aggregate operating balances as a percentage of aggregate total assets.
14: Aggregate operating balances as a percentage of aggregate equity.
15: Crown Ownership Monitoring Unit, 2013 Annual Portfolio Report, pages 4 and 6.
16: See Appendix 2.
17: Crown Ownership Monitoring Unit, 2013 Annual Portfolio Report, pages 47, 52, 53, and 60.
18: Crown Ownership Monitoring Unit, 2013 Annual Portfolio Report, pages 46 and 48.
19: See Appendix 2.
20: Crown Ownership Monitoring Unit, 2013 Annual Portfolio Report, page 56.
21: Crown Ownership Monitoring Unit, 2013 Annual Portfolio Report, page 53.

