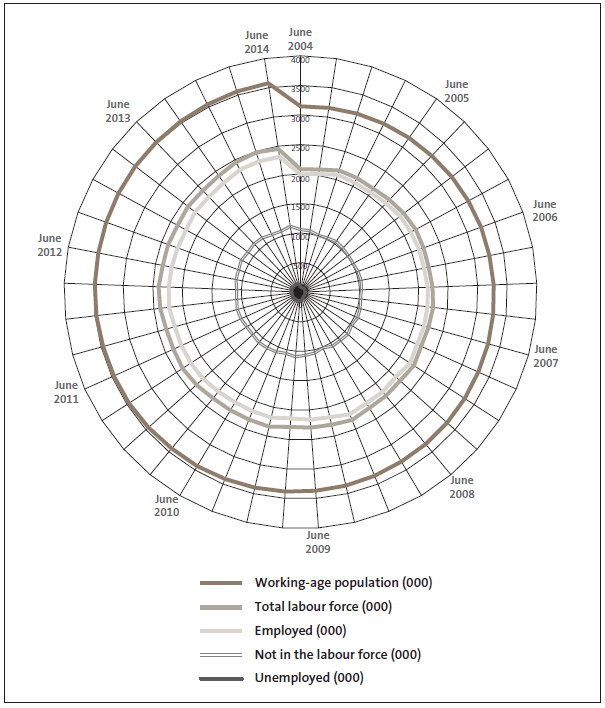
Appendix 3: Labour market movements in New Zealand, 2004 to 2014
Ministry of Social Development: Using a case management approach to service delivery.
This graph shows the growth in the New Zealand working-age population, and the breakdown of that population by employment status. The graph brings the two ends of the data series lines (June 2004 and June 2014) closer together so the differences can be seen.

Source: Statistics New Zealand (not seasonally adjusted).

