Part 3: Local government finances – A historical perspective
The following report was prepared for us by the New Zealand Institute of Economic Research. We have included it in its entirety.
About NZIER
NZIER is a specialist consulting firm that uses applied economic research and analysis to provide a wide range of strategic advice to clients in the public and private sectors, throughout New Zealand and Australia, and further afield.
NZIER is also known for its long-established Quarterly Survey of Business Opinion and Quarterly Predictions.
Our aim is to be the premier centre of applied economic research in New Zealand. We pride ourselves on our reputation for independence and delivering quality analysis in the right form, and at the right time, for our clients. We ensure quality through teamwork on individual projects, critical review at internal seminars, and by peer review at various stages through a project by a senior staff member otherwise not involved in the project.
Each year NZIER devotes resources to undertake and make freely available economic research and thinking aimed at promoting a better understanding of New Zealand’s important economic challenges.
NZIER was established in 1958.
Authorship
This paper was prepared at NZIER by Shamubeel Eaqub, CFA.
It was quality approved by Derek Gill.
The assistance of Statistics New Zealand is gratefully acknowledged.

L13 Grant Thornton House, 215 Lambton Quay | PO Box 3479, Wellington 6140
Tel +64 4 472 1880 | [email protected]
© NZ Institute of Economic Research (Inc) 2014.
NZIER’s standard terms of engagement for contract research can be found at www.nzier.org.nz.
While NZIER will use all reasonable endeavours in undertaking contract research and producing reports to ensure the information is as accurate as practicable, the Institute, its contributors, employees, and Board shall not be liable (whether in contract, tort (including negligence), equity or on any other basis) for any loss or damage sustained by any person relying on such work whatever the cause of such loss or damage.
Key points
The Office of the Auditor General (OAG) has asked NZIER to paint a broad picture of local government revenue and capital expenditure in a historical context.
We have collated long term data on local government revenue and capital expenditure, spanning over a century.
The past century has been a time of considerable economic progress and change. Some of the same forces of progress are causing population and economic growth to concentrate in some places, but to hollow out in others.
For local government, it matters where people choose to live and work. Local authorities need to plan the operating and capital required for their services and related funding.
Our historical analysis shows that local government income is highly dependent on the legislative mandate set by the Parliament, and strongly affected by fluctuations in central government funding and the overall economic cycle. Local authorities were responsible for a number of public utilities (such as electricity distribution), until reforms in 1989.
Rates have been the most stable source of revenue. Rates have trended higher on a per household and per capita basis, after removing the effects of inflation. But rates are at historic lows relative to the value of the housing stock (the asset base) and have been broadly stable relative to GDP (proxy for income or affordability) since 1945.
Future rates affordability will depend critically on the outlook for population growth, the mix of population (e.g. older versus young, employed versus unemployed) and income growth. Different regions need to plan for quite different futures.
Future rates will need to pay for local government current operations, as well as for capital expenditure on costly long-lived assets. Long term trends show that there have been two big waves of investment, in 1910-1930 and in 1950-1986. These waves were synchronised across different types of assets. Such investments will ‘echo’ in the future as they come to the end of their useful lives. Understanding these historical echoes will be vital when preparing and planning for significant and costly capital projects. Whether because of these echoes or not, capital investment has been historically low relative to population and income in recent decades. This suggests looming bulge of capital renewals and replacements in coming decades.
An analysis of investments plans (in the data collated by the National Infrastructure Unit (NIU) and Long Term Plans (LTPs)) shows that there is considerable range in forecasts. The certainty of forecasts reduces with time and actual investment is running below forecasts. A key challenge will be developing robust plans that can accommodate a range of plausible future states and enhance the resilience and adaptability to change.
The historical data paints a picture of a changing local government sector over time. Its purpose, role and ways of funding have changed over time. Large capital assets were built in waves which will eventually need costly replacements. Having a realistic and detailed asset management plan, co-ordinated with affordable rates will be important.
Contents
1. A backdrop of changing regional economies
2. The short story on regional divergence
3. Historical context
4. Revenue
5. Capital expenditure
6. Where the capital is spent
7. Plans versus action
Appendix A Long term investment trends
Appendix B Local government rates and investment history
1. A backdrop of changing regional economies
New Zealand is a developed economy but our national averages hide regional differences. Some small towns have few jobs and lower incomes, and life opportunities are not as great as elsewhere. Economic progress is passing some places by. Section 2 presents our one page short story on what is driving diverging demographic and economic outcomes in our regions.
These divergent outcomes matter for the local government sector because local authorities provide services to people which are paid for by those communities largely via rates. The two key drivers of rates affordability are:
- population growth
- income growth and/or economic growth.
Local authorities need to plan appropriately for the population, job and income growth prospects for their regions. Some locations will experience strong population and economic growth, others may be flat and some may contract.
The various scenarios of population and economic growth matter for local authorities. They need to plan for their services expenditure (operating and capital) and the required, related funding.
In the provinces of New Zealand, where population ageing is already a fact of life, some pressures are emerging. Retirees are often asset rich but income poor. Their real incomes are fixed and often they are running down savings. They feel cost increases more acutely. Some local authorities may find themselves in a bind if their residents are unable to pay more in rates, but they still have to maintain roads, drinking water, sewerage and other services to high performance standards.
Ageing may mean that household incomes and rates affordability will be under increasing pressure due simply to demographics. The fastest emerging type of household is ‘living alone’; typically older people and those with relatively low incomes. This means that there will be more households relative to population growth, but income per household will not be growing as strongly as before.
If personal income were to hypothetically increase by 2% a year over the next 30 years, household incomes may rise by only 1% a year because of ageing and smaller households. This means that ageing will affect rates affordability.
In the US many local authorities have gone into bankruptcy. We have not found evidence that financial failure has been catalysed by infrastructure failures – but financial distress has led to urban and infrastructure decline.
In the US, local government finances have been blighted by large pension costs – which New Zealand does not have. But this is a short term reprieve. In places with ageing and shrinking populations they may be saddled with too many assets like roads and water treatment plants that will require ongoing maintenance and eventual costly replacement. They may be stranded with assets that become uneconomic burdens. These are long term risks.
Many of the drivers of local economies are not due to local factors. Gales of change are being driven by technological progress, urbanisation, globalisation and ageing. Local authorities need to know their regions and understand the range of plausible futures that must be prepared for. Planning for hoped growth in population and economic activity is not reasonable. History can provide a good guide to the future – although not always (e.g. the recent reversal in population decline in Southland due to international immigration).
Local authorities each need to have a credible asset management plan, that begins with a detailed understanding of their economy, current asset base, future needs and the best financial and asset management strategy to put the plan into effect.
Regions can be organised into various groups depending on the metric used to assess:
- Rates affordability - if required futures rates will be affordable for the local community
- Capital affordability – if required future capital investments can be funded sustainably
- This would require a good understanding of what is driving the demand for capital assets.
- Three broad groups appear likely:
- Prosperous and growing places, which will need increasing capital
- Prosperous or growing places, which may need more capital
- Poor and/or declining places, which may need to plan for a lower requirement for capital (e.g. divestment, etc.).
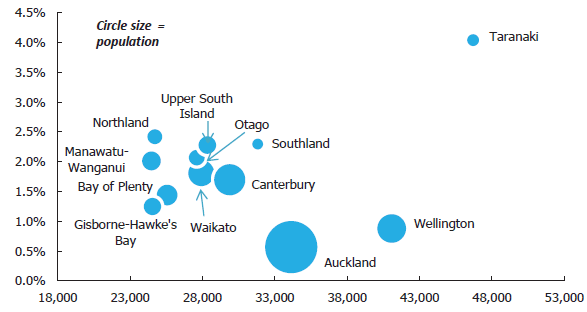
Figure 1 Regional economic performance in the 2000s
Real GDP per capita 2010, horizontal scale; Compound annual growth rate 2000-10, vertical scale
Source: NZIER estimates, Statistics New Zealand data
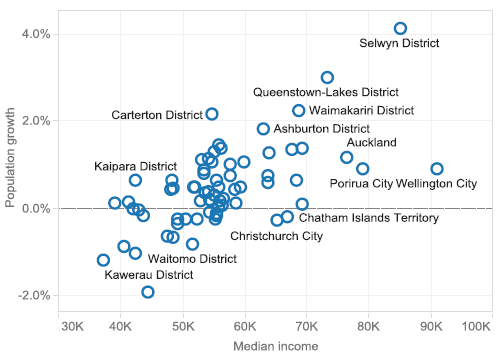
Figure 2 Different economic states of regional districts
Median annual household income, x-axis; 2006-2013 population growth p.a., y-axis
Source: Statistics NZ, NZIER
2. The short story on regional divergence
New Zealand has a highly centralised state, but its regions are not the same. They share some common traits, but performance is diverging across incomes, employment and population.
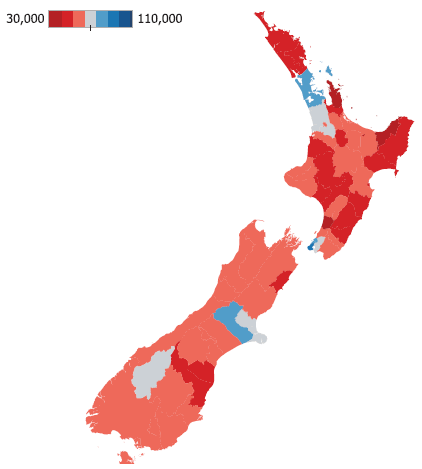
Over many decades the economic performance of regions has diverged. An example of this is median household incomes, which vary significantly between regions. This has been due to a number of related and self-reinforcing trends: urbanisation, technological change, globalisation and increasingly ageing. These are global forces that are unstoppable and they are speeding up. That means future jobs will be in different industries, occupations and places. These patterns have been evident in other peer countries like the US and UK too.
Figure 3 Median household income by territorial and unitary authority (2013)
Median household income from 2013 Census ($)
Source: Statistics New Zealand, NZIER
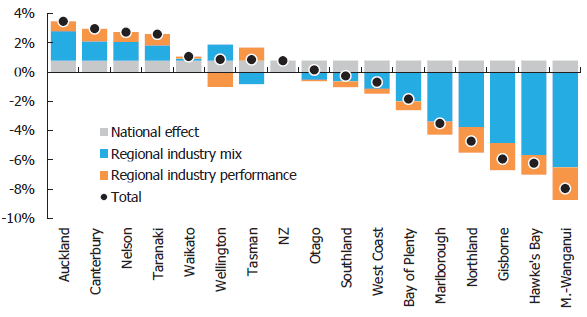
Over recent decades Auckland has created more jobs than other places. This has been because it is a large urban centre that can support highly connected professions like ICT, finance, law, etc. Most of New Zealand’s other regions’ economies are historically based on agriculture and manufacturing – sectors that are losing jobs. This puts these provinces on the back foot. Figure 4 shows that between 2006 and 2013, employment grew in Auckland because it is in the industries that are growing and Auckland is outperforming other regions. But the story is reversed for many regions, including Northland, Gisborne, Hawke’s Bay and Manawatu-Wanganui.
Figure 4 Employment growth by region
Growth rate per year, %, 2006-2013
Source: Statistics New Zealand, NZIER
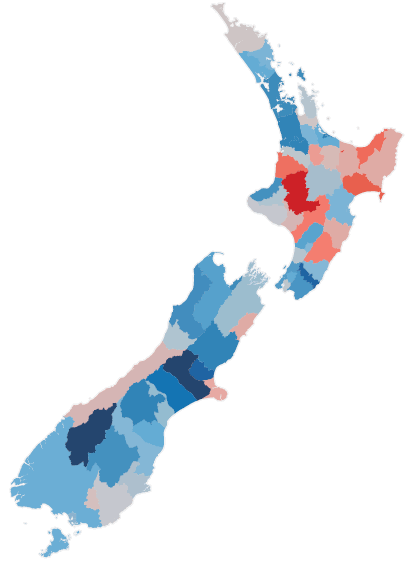
People are voting with their feet, and many small places have declining populations (Figure 5). Fewer job opportunities mean that households cannot aspire to good incomes and lifestyles in many parts of New Zealand. Young people from the provinces are more likely to leave (particularly for overseas) than those from large urban centres. Young people are leaving and the population is ageing, and growing slowly or declining in many parts of New Zealand. This can be a vicious cycle.
Ageing will do many things. There will be fewer workers and entrepreneurs. Demand for goods and services will change – more health services and aged care, but different food and entertainment. Older age groups tend to be asset rich but income poor; they may resist rising local authority rates and service rationalisation.
But not all is lost. Some regions are doing better than others. Places like Southland and Taranaki, which are experiencing strong economic growth supported by a dairy and oil boom respectively, have seen better population growth through migration. Migration has important implications for social and cultural cohesion – a sudden influx can disrupt community trust if immigration is not handled with care and immigrants helped to integrate into society. Paul Collier in Exodus suggests a need for the social and economic integration of migrants to reduce the potential risks from immigration and maximise the potential benefits.
Figure 5 Population growth (2006-2013)
Annual growth rate per year, %, 2006-2013
(dark red is -3%; dark blue is +3%)
Source: Statistics New Zealand, NZIER
3. Historical context
The OAG has asked NZIER to develop a narrative for regional economies and the implications for local authorities’ revenue and investment plans (particularly for roading and water assets).
In this initial scoping report we have collated long term datasets covering:
- sources of revenue, from 1881-
- investment data (partial), from 1905-
- more detailed investment data, from 1947-
- very detailed investment data, from 2008-
This historical data is helpful in building pictures of investment patterns and to document changes in the local government sector over time. History also gives much needed context, for example ‘lumps’ in investments that are likely to ‘echo’ in the future and different natures of investment.
The data should be used with caution, as they are from various sources and span significant changes in how the local government sector was organised, what local authorities did and how they were funded. There is limited historical balance sheet data making the analysis partial. The historical data can be used to paint a broad brush picture of structural change.
4. Revenue
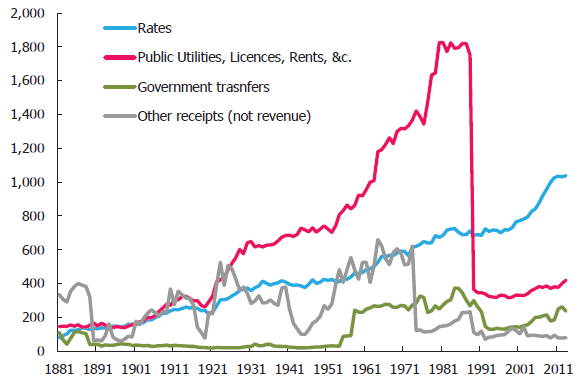
We have collated local government revenue data from 1881 to 2013. Figure 6 shows the sources of revenue over this long time period. The data is shown on a per capita basis and after removing the effects of inflation (because historical data are small in absolute terms).1
In 1881 the total receipts for the local government sector was $2 million, compared to $7,880 million in 2013 in dollars of the day. Adjusting for much lower prices in 1881, the ‘real’ or comparable income in 1881 was $147 million. On a per capita basis, this translates to $281 in 1881 and $1,773 in 2013.
The data on total receipts incorporates a range of changes in the local government sector over time, including the types and quality of services provided by local government controlled organisations. For example, public utilities and related services such as electricity distribution and ports were an increasingly larger source of revenue and operation of local government. But that changed during the reforms of 1989, when many utilities were no longer under the gambit of local government. This is evidence that the local government sector is a creature of central government statute and that local authorities change when the legislation changes (more detail on some of these changes are in Appendix B).
Successive changes in the local government sector’s role and the way it is funded is also visible in the data. Government transfers show clear shifts in various phases of the economy, sometimes increasing (for example the inter-war period and during the large ‘nation building’ phase of the 1950s-1970s) and sometimes decreasing (for example during the fiscal crunch of the 1970s when the New Zealand central government’s indebtedness started to increase while it was trying to manage two successive oil shocks within a decade).
Figure 6 Local government receipts (1881-2013)
$ per capita, after removing the effects of general inflation (in 2013 prices)
Source: Statistics New Zealand, NZIER
Through successive reforms rates revenue has remained a steady source of income for the local government sector. Successive reviews of the local government sector have also tended to view rates as a viable and appropriate source of revenue, although there have been changes at the edges around differential rating, rebates and other adjustments.
Rates revenue is typically levied on the value of the housing stock. However, rates affordability is a function of income not the value of houses – although the two tend to be correlated.
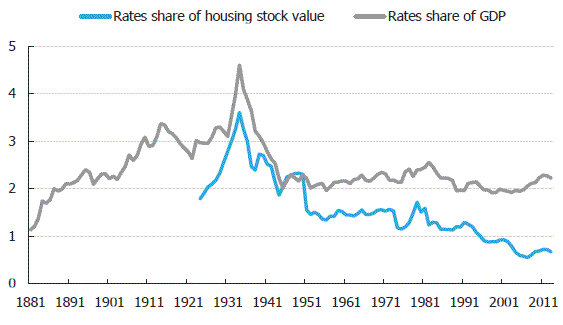
Figure 7 shows rates revenue as a share of the housing stock (1923-2013) and as a share of GDP (1881-2013). It shows that rates revenue as a share of the housing stock peaked in 1934, when house prices and economic activity slumped during the 1929 Great Depression. Since then, rates have trended lower relative to the value of the housing stock.
Rates as a share of GDP is a broader measure of rates affordability, as GDP tends to describe household incomes and thus their ability to pay the rates to local government. As context, household disposable income (after taxes and other payables) was around 60% of GDP in 2013. We use GDP in our analysis as there is a longer and consistent history of the data.
Rates have ranged between 2% and 3% of GDP between 1945 and 2013, after trending up between 1881 and 1934. The Great Depression era was impacted by economic contraction, rather than an outsized increase in rates.
Figure 7 Rates revenue as a share of GDP and housing stock value (1881-2013)
% of GDP and housing stock value
Source: Statistics New Zealand, NZIER
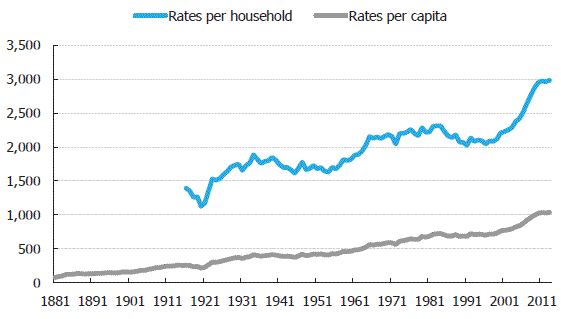
Figure 8 Rates revenue per household and per capita (1881-2013)
$ per capita and per household, after removing the effects of general inflation (in 2013 prices)
Source: Statistics New Zealand, NZIER
To assess the trend in rates, without the influence of changes in housing and economic cycles, we present rates revenue a per capita and per household basis in Figure 8, after removing the effects of inflation. The long term trend in rates is upwards, both on a per household and per capita basis. Importantly, this does not look at changes in the quantity and quality of services provided by local government.
Between 1916 and 2013, almost a century, rates per household have increased by 0.8% per year in excess of general CPI inflation. On a per capita basis, real rates have increased by 1.4% a year. The pace is faster on a per capita basis, as household sizes have shrunk over time, meaning the rates bill is shared across more households.
Shrinking household size means that the growth in households is faster than population growth. This will accelerate over coming decades due to an ageing population – who are more likely to live alone. Understanding of future rates affordability requires careful assessment of who will be making up future households. For example, a retiree living alone on a fixed income will have less ability to absorb rate increases than a young family that can expect their incomes to rise over time with work experience and skill accumulation.
Population decline is also a risk for some local authorities. In the 2013 Census, 20 local authorities had declining populations. In these places, economic and political factors may mean that rate increases cannot be implemented.
1 Through this report we have used the CPI as the deflator for general price movements. Deflating spending and revenue by the CPI measures the opportunity cost to taxpayers (but does not measure the real volume of resources used).
5. Capital expenditure
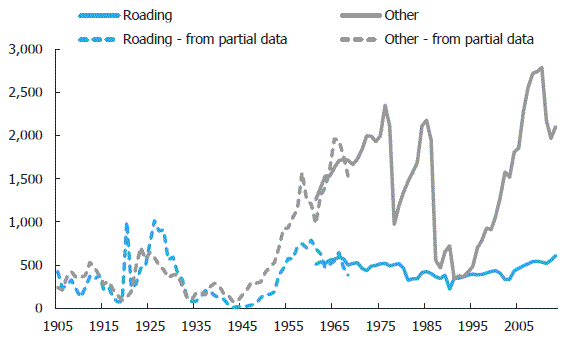
We have collated indicators of local government capital expenditure from 1905 to 2013. Data prior to 1962 are only partial, based on central government loan approvals for local government projects, which may have been part funded or may not have been done. While the data is partial, it is nevertheless useful for understanding the nature of the investment cycles for long-lived assets.
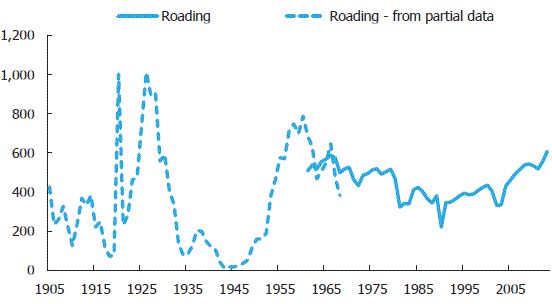
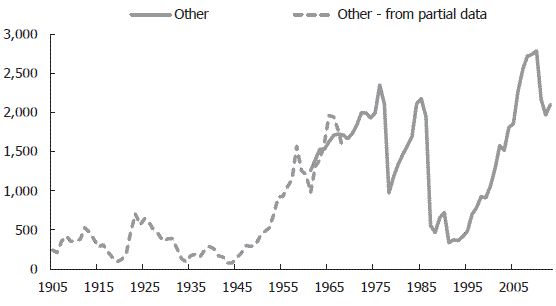
Figure 9 summarises our capital expenditure indicators for roads (which has good data available and has been collated by the Ministry of Transport) and a catch-all ‘other’ capital expenditure. The figure shows a clear pattern of eras of investment with intermittent pauses.
Some assets such as water networks can have useful lives of 100 years or more. That means if investments were ‘bunched’ in history, their costly renewal and replacement may also ‘echo’ in similar bunches in the future.
The historical data is not available in sufficient and consistent detail to paint a definitive picture of local government investment. We use partial indicators to add colour.
There are two clearly identifiable surges of investment in 1920-1930 and long boom in investment from 1950-1986 for non-road investments – although with considerable volatility. Investment in roads peaked in around 1965, then trended lower until 1990. Investment in roads trended higher between 1990 and 2013.
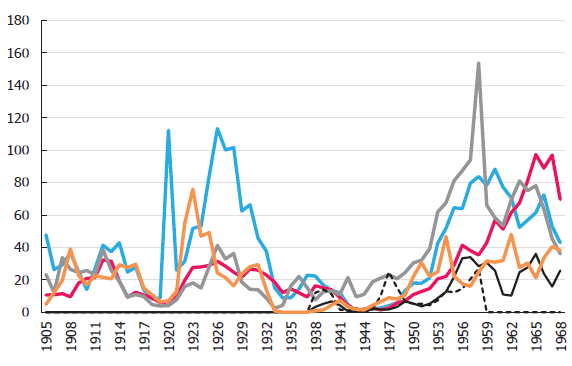
Figure 10 shows the borrowings by local government between 1905 and 1968 for various types of capital investment. The figure shows that the different types of capital investment have tended to be synchronised, suggesting that future renewal and replacement may also be similarly bunched. Or it suggests that we will hit ‘block obsolescence’ as many capital assets reach the end of life at the same time.
Figure 9 Local government capital expenditure indicators (1905-2013)
$m per year, after removing the effects of general inflation (in 2013 prices)
Source: Statistics New Zealand, NZIER
Figure 10 Local government borrowing for different types of capital expenditure (1905-1968)
$m per year, after removing the effects of general inflation (in 2013 prices)
Source: Statistics New Zealand, NZIER
The investment in capital in the 1905-1968 period in Figure 11 appears to be largely in capital expansion or the building of new capacity. This is consistent with available New Zealand historical literature and feedback from industry experts.
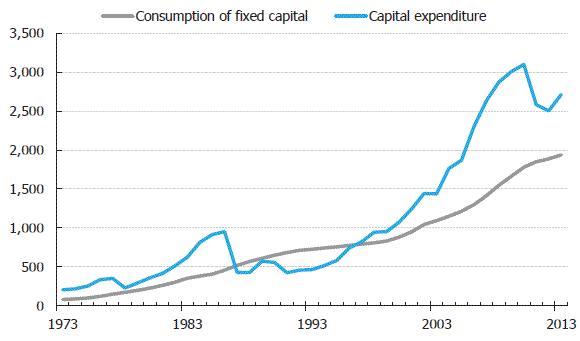
Consistent data for the 1973-2013 period shows that a broad pattern of capital accumulation has continued, with capital expenditure outstripping economic depreciation (or consumption of fixed capital) for much of this period. The only exception was 1987-1996, when investment was below depreciation – suggesting this was a period of sustained ‘under-investment’.
Figure 11 Investment and consumption of fixed capital (1973-2013)
$m per year
Source: Statistics New Zealand, NZIER
6. Where the capital is spent
More recent data on the components of capital expenditure is more difficult to access. The data is not always reported in a consistent format and official data is at an aggregated level.
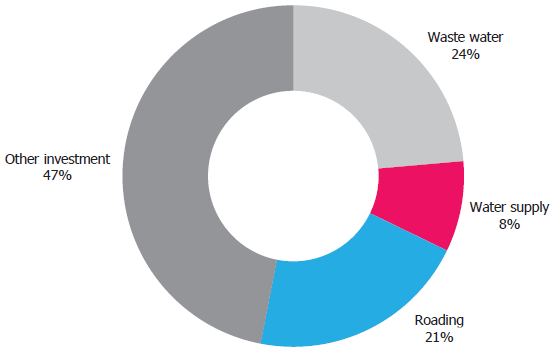
Figure 12 shows the components of expenditure over the decade to 2012. Waste water (24%), roads and bridges (21%) and water supply (8%), together account for just over half of all capital expenditure. However, this leaves a sizeable 47% of assets lumped into an unexplained ‘other’.
Figure 13 shows a little more detail from a partial data source: an unpublished level of detail in a Statistics New Zealand survey. This data is not consistently reported by respondents and should be used as an indication only. This figure shows that other investment is broadly dispersed across a range of activities from software to social housing and is not as easily grouped as the large areas of expenditure: roads and bridges, storm water, sewerage and drinking water.
Figure 12 Local government additions by fixed assets (2003-2012)
Additions to fixed assets for 2003-2012 cumulative
Source: Statistics New Zealand, NZIER
Figure 13 Local government additions by detailed fixed assets (2008-2012)
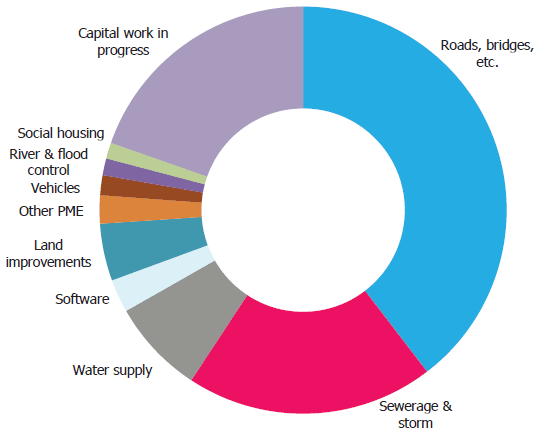
Additions to fixed assets for the top 10 classes of fixed assets, 2008-2012 cumulative
Source: Statistics New Zealand, NZIER (experimental data from SNZ survey from unpublished level of detail)
7. Plans versus action
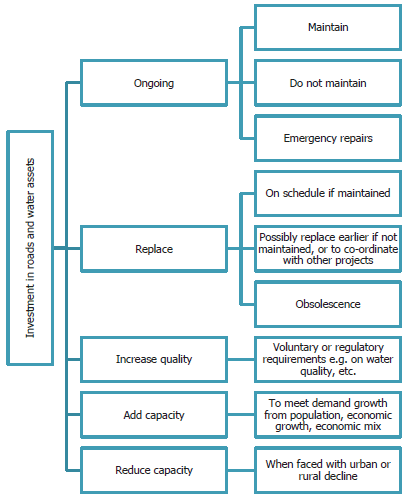
We use the following framework to think about investment plans. This is a broad frame and we have not populated this, as there is insufficient data at the macro level to understand the motivation for each type of investment (replacement versus maintenance for example).
Figure 14 Stylised map of drivers of investment
We have looked at projected spending patterns in the Long Term Plans (LTPs) and self-reported capital intentions to the National Infrastructure Unit (NIU). Our analysis suggests that the bottom up investment plans do not appear to fully match up with the totals presented in the LTPs. This requires further exploration, as it may hint at a lack of detailed planning, forecasting bias due to the bow wave effect or normal forecast uncertainty.
Figure 16 shows analysis of LTPs by the OAG. It illustrates that the actual investments recorded in annual reports are quite different from that forecasted in earlier annual reports and in successive LTPs. This analysis suggests that capital planning has considerable variation and uncertainty.
Figure 15 Local government self reported capital expenditure plans
2012$m, estimated from intentions
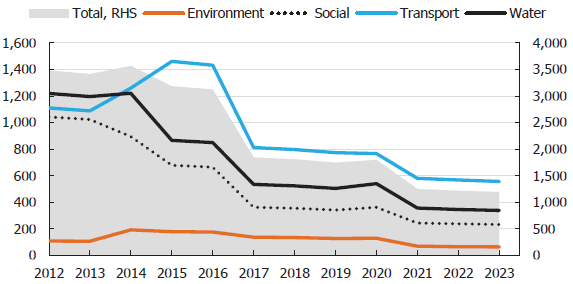
Source: NIU, NZIER
Figure 16 Local government capital expenditure: planned and actual
$b per year
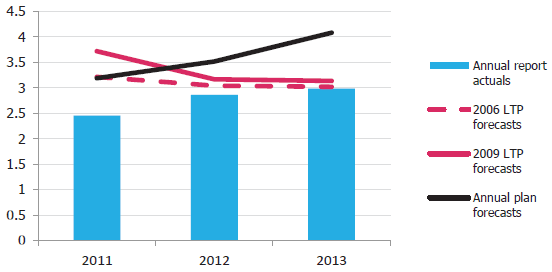
Source: OAG analysis of Long Term Plans
Appendix A Long term investment trends
Figure 17 Local government spending on roading (1905-2013)
$m per year, after removing the effects of general inflation (in 2013 prices)
Source: Statistics New Zealand, NZIER
Figure 18 Local government spending other than roading (1905-2013)
$m per year, after removing the effects of general inflation (in 2013 prices)
Source: Statistics New Zealand, NZIER
Appendix B Local government rates and investment history
The following extract from the 1990 New Zealand Official Year Book2 provides a helpful historical narrative.
| Roads and drains always built with rates Rates are property taxes levied by local authorities to pay the wide range of services they provide. They have been used in New Zealand since the earliest days of European colonisation. Early rating Early colonists based the first rating systems on those they knew in England. These were a variant of annual rental value rating. In 1842 a Municipal Corporations Ordinance was passed which stipulated that any district with a population of 2000 or more would become a borough and would have a council with the power to make rates. It only affected Wellington, since in 1842 it was the only district with a population of that size. As local government evolved in New Zealand, the 1842 ordinance was replaced piecemeal by other ordinances. There was also a brief period from late in 1844 when the Customs Tariff was replaced by property rates as the main source of central government finance—but the scheme was a resounding failure and the tariff was soon restored. The Constitution Act of 1852 had a major effect on New Zealand politics, not only did it bring responsible government it also established six provinces. Each province had the power to raise funds by rates, and initially the annual rental value system was used. However, using the property's annual rental value to set the rates was seen by some as discouraging development of land. The ‘system rated settlers who worked hard to improve their land more heavily than those who left the land undeveloped. There were also fears that speculators would exploit the situation. In some parts of the country attempts were made to make the system more equitable by shifting to the ‘capital’ or the ‘land value’ system of rating. These systems emphasised the price that each property would bring on the market rather than the rent it might gain. This meant a measure of the potential value of the land for development was included, not just the amount of work that the owner had put in. From the 1860s central government became concerned that there were enormous disparities in the services provided by local authorities, and in response it established some basic standards of service provision. The Municipal Corporations Act 1867 set out compulsory functions and model bylaws for each town or district, but did not affect rural New Zealand. The municipal corporations were obliged to raise more funds to pay for their compulsory services. Around the same time central government decided to institute standard procedures for the rating of Maori land. Under the Treaty of Waitangi, Maori were to be treated as British citizens, and landowners had an obligation to pay rates, but in recognition of the different land ownership system for Maori a separate legal body was established to settle land disputes, including rating. The Native Land Act 1865 established the Native (Maori) Land Court. Among the powers of the court was that it could recommend to the Governor that he issue an Order in Council exempting any Maori freehold land from all or part of its rates. The court could also assist local authorities to recover unpaid rates debts on Maori land. After the provinces 1876–1920s The provinces were abolished in 1876 and replaced by counties, municipalities (towns and districts) and road boards. Following abolition, rating was rationalised to provide local government with a unified system of rating. The Rating Act 1876 made the annual rental value system universal. Each local body was also required to appoint a valuer to prepare a valuation roll. Concerns about property speculators exploiting the annual value rating system resulted in a new Rating Act being introduced in 1882. This act replaced the ‘annual rental value’ system with the ‘capital value’ system. It also transferred valuation powers from local authorities to central government property tax assessors to ensure more consistent standards of valuation throughout the country. Many boroughs opposed the changes, and in response government decided to allow some authorities exemptions from having a capital value rating system or from using government valuers. Subsequent amendments to the law gave local authorities a choice of annual rental or capital value. In 1896 a partial unimproved value rating system was brought in. This was extended to full unimproved value rating in 1912, and many local authorities changed rating systems during this period. Between the wars The 1920s were a period of gradual expansion in New Zealand. Between 1920 and 1930 rates revenue almost doubled. By the 1930s government had instituted many measures to coordinate local authority planning, borrowing, roading and expenditure. Acts like the Main Highways Act 1922, the Town Planning Act 1926, the Local Government Loans Board Act 1926 and the Housing Act 1935 expanded the role of local government. Government also provided some finance to pay for these compulsory functions with grants, subsidies and loans. As the Depression began to take hold, many plans for developments such as civic centres were delayed, although local authorities became employers of many people under Unemployment Board subsidies—often on roading and other ‘minimum cost’ public works. Between 1930 and 1945 rates paid to local authorities increased by only 31 percent. The post-war years After World War II central government undertook many reviews of local government structures and finance. A number of these reviews resulted in minor changes to rating legislation. All three systems of rating continued to be used side-by-side. Reviews also reaffirmed that ‘rating should continue to be the basis of local government taxation’. Repeated reviews raised concerns that rating should be equitably applied. In 1970, the Counties Act was amended to allow differential general rating, and this requirement was later included in the Municipal Corporations Act 1954. Under ‘differential rating’ a local authority could have different levels of rates for different types or groups of property. This allowed a higher proportion of rates to be levied on properties making greater use of services, such as commercial and industrial properties. The Rates Rebate Act 1973 was brought in to reduce the rating burden for landowners living on low incomes, retired people and widows. The Act provided for rates rebates which were paid back to local authorities by central government. Recent years have seen further simplification of rating legislation. The Rating Powers Act 1988 laid down how a rating system should be run by any type of local authority whether it be city council or catchment board. In October 1989 central government completed a major reorganisation of local government, including its structures, functions and finances. A related review of local government finances concluded in 1989 that rating should remain the main method of funding for local authorities. |
2 Statistics New Zealand, available at http://www3.stats.govt.nz/New_Zealand_Official_Yearbooks/1990/NZOYB_1990.html.

