Delivering scheduled services to patients
Introduction
1.1
In June 2011, we published our report on the progress that the Ministry of Health (the Ministry) and district health boards (DHBs) had made towards achieving the objectives of a strategy released in 2000 – Reduced Waiting Times for Public Hospital Elective Services: Government Strategy (the Strategy).
1.2
Elective services are non-urgent medical and surgical services (specialist advice or a form of treatment, or both). In this progress report (and in our 2011 report), we call these scheduled services. This is partly because the lack of urgency means the services are scheduled ahead of time and partly because the term “elective” suggests that there is a degree of choice that the patient might not agree they have.
Our findings and recommendation
1.3
Despite the improvements that DHBs had made in the 10 years before we published our report, we found that New Zealand did not yet have a nationally consistent and equitable system for scheduled services.
1.4
We recommended that the Ministry and DHBs agree:
- what they would do to improve their progress in more fully achieving the Strategy's objectives; and
- when they would do it and how they would demonstrate that improvements had been achieved.
1.5
The priority areas that we recommended they focus on were ensuring that:
- patients are more consistently selected for first specialist assessments;
- patients are more consistently prioritised for treatment;
- a greater proportion of patients receive scheduled services within the expected time limits;
- a greater proportion of patients are treated in priority order; and
- progress is made in quantifying the level of unmet need for scheduled services.
1.6
We encouraged the Ministry, DHBs, and medical specialists to identify any disincentives to further progress. We also encouraged them to focus on putting in place systems and tools to ensure that patients with the greatest need have access to services at the right time.
The response to our findings and recommendation
1.7
The Ministry supported our recommendation. Since October 2011, we have received regular progress reports from the Ministry. We are satisfied that it has worked with DHBs to better meet the objectives of the Strategy.
1.8
In April 2013, we provided a brief update on our assessment of progress in Health sector: Results of the 2011/12 audits. This report provides a more detailed assessment of the Ministry’s and DHBs’ progress.
Agreeing what will be done to improve progress
1.9
The Ministry and DHBs agreed six priority objectives, put processes in place to implement those objectives (where work was not already under way), and came up with methods to show progress towards meeting those objectives.
1.10
The six objectives address the five priorities that we identified in our 2011 report. They are:
- Increase available services by improving capacity, productivity and efficiency.
- Work towards everyone having equal access to elective surgery no matter where they live.
- Improve the way patients are prioritised to ensure fairness, value for money and that those who access services are those with the greatest need and ability to benefit.
- Improve the management of patients (patient flow) to reduce waiting times.
- Support new and innovative ways of providing Electives, such as adopting alternative pathways and models of care.
- Support clinical networks, such as the National Cardiac Surgery Clinical Network, to improve delivery of services.
1.11
The Strategy was updated in 2012 to reflect new expectations of shorter waiting times (see paragraph 1.21).
The time frame for making changes
1.12
The six priority objectives will be implemented over several years, and time frames for implementing the objectives are set as part of annual planning cycles. We are satisfied with the Ministry’s and DHBs’ approach to deciding time frames for action.
Demonstrating that improvements have been achieved
1.13
The last part of our recommendation was that the Ministry and DHBs decide how they will demonstrate that improvements have been achieved. To assess this, we will highlight some of the work that has been done to address the five priorities that we identified in 2011.
More consistently selecting patients for a first specialist assessment and prioritising them for treatment
1.14
The Ministry and DHBs have set overall objectives for their work on more consistently selecting patients for a first specialist assessment (FSA) and prioritising them for treatment. These objectives are to get new prioritisation tools into use more quickly than in the past, ensure that these tools are fit for purpose, and increase the use of existing modern tools.
1.15
The Ministry convened a group of representatives from medical practitioners’ colleges and DHBs to discuss options for preparing a nationwide tool for consistently prioritising patients for an FSA for all medical and surgical specialties. The group agreed on draft universal criteria.
1.16
The Ministry is surveying DHBs to find out whether and how the nationwide FSA tool could affect existing “clinical pathways” (the steps a patient goes through from the start to the end of their treatment). Once any potential problems are resolved, the universal criteria can be finalised and a plan agreed to implement the nationwide FSA tool. The Ministry plans to choose trial sites by the end of 2013 and trial the tool in those selected DHBs during 2014.
1.17
The Ministry is leading a programme to ensure that existing prioritisation tools for treatment are up to date. The programme will introduce new nationwide tools for specialties that have not had them before. It is giving priority to introducing new tools for high-volume surgical services. Figure 1 provides a summary of the Ministry’s progress since 2011 in introducing or revising selected prioritisation tools.
Figure 1
Summary of actions taken since 2011 in introducing or revising selected prioritisation tools
| Treatment prioritisation tools | Initial preparation | Trial | Implementation | Clinical audit and review | Tool revision |
|---|---|---|---|---|---|
| Bariatric surgery | • | • | • | • | |
| Cardiac surgery: urgency | • | • | |||
| Cardiac surgery: appropriateness | • | • | |||
| Cataract | • | • | |||
| Colonoscopy | • | ||||
| Ear, nose, and throat | • | • | |||
| General surgery | • | ||||
| Gynaecology: general | • | • | |||
| Gynaecology: sterilisation | • | • | • | ||
| Orthopaedic: hip or knee replacement | • | • | |||
| Orthopaedic: other | • | ||||
| Ophthalmology | • | ||||
| Plastic surgery | • |
Source: Ministry of Health.
1.18
The tools are being updated or prepared by working parties made up of representatives of the specialists who will use them. The representatives are nominated by the relevant professional body, which formally approves the tools at each stage of the process and agrees a plan to implement them with the Ministry.
1.19
The Ministry is also working with DHBs to increase the adoption and use of all the tools. Some of the actions it is taking to encourage adoption and use are:
- using trial sites to find out the best ways of integrating prioritisation tools into the way that patients are managed;
- providing clearer guidance on how to use the tools;
- providing clearer information about the benefits of effective prioritisation for patients and DHBs; and
- encouraging clinicians to publish reviews of clinical prioritisation systems.
Providing more services within expected time limits
1.20
The Strategy had always aimed to ensure that patients would wait no longer than six months to receive an FSA or treatment. However, the requirement to do so was not enforced until 2006, when it was enforced with agreed tolerance limits (buffer). A substantial number of patients continued to wait longer than six months because of the size of the buffer.
1.21
In February 2012, the Ministry introduced a plan that all patients waiting for a scheduled FSA or treatment should wait no longer than:
- six months from 1 July 2012;
- five months from 1 July 2013; and
- four months from 1 January 2015.
1.22
There was one exception to this. After the Canterbury earthquakes in 2010 and 2011, Canterbury DHB was allowed more time than other DHBs to meet the goals for shorter waiting times.
1.23
The Ministry can demonstrate whether the DHBs have met these goals by reporting on the length of time that patients have waited for an FSA and treatment. (There is still buffers, but they are now so small that they do not affect how long individual patients wait for an FSA or treatment.)
1.24
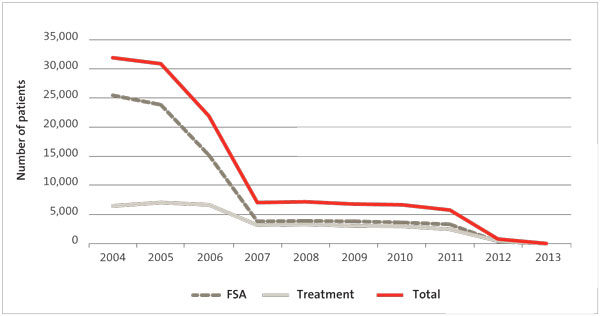
Figure 2 shows that the goal of providing services within six months by 1 July 2012 was not met. However, significant progress was achieved. Of the patients who waited longer than six months for a scheduled service, 614 (80%) were Canterbury DHB’s patients.
Figure 2
Number of patients waiting longer than six months for a first specialist assessment (FSA) or treatment at 30 June, 2004-13
Notes: Canterbury DHB’s data is included. Data for 2004-12 was extracted from the National Booking Reporting System on 2 July 2013. Data for 2013 was extracted on 8 August 2013. The database is dynamic, which means that this data may differ from data previously published by the Ministry of Health.
1.25
Figure 2 also shows that DHBs made further improvements in 2012/13. At 30 June 2013, 20 patients nationwide had not received services within six months. Of these 20, three were Canterbury DHB’s patients and 17 were one other DHB’s patients.
1.26
Our interest is in assessing whether patients receive services within six months because that was the standard that applied at the time of our audit. However, at the end of June 2013, all patients received scheduled services within five months except for:
- 378 patients who had waited longer than five months for an FSA (79% of this group were Canterbury DHB’s patients); and
- 122 patients who had waited longer than five months for treatment (72% of this group were Canterbury DHB’s patients).
1.27
DHBs have also made progress in treating people who have waited a long time for treatment:
- Of the surgical patients in the National Booking Reporting System (NBRS) treated in June 2013, 12 patients had waited more than 12 months for treatment. In contrast, 69 patients treated in June 2010 had waited more than 12 months for treatment. Four of the 69 patients had waited more than 24 months for treatment.
- Of the medical patients in the NBRS treated in June 2013, nine patients had waited between six and nine months for treatment. In contrast, 10 patients treated in June 2010 had waited between nine and 24 months for treatment.
1.28
At the same time as introducing shorter waiting times for an FSA and treatment, DHBs are increasing the number of operations they deliver by at least 4000 a year. The aim of this is to increase access. Since 2007/08, the average increase has been more than 8000 operations a year. In 2012/13, DHBs delivered 10,223 more surgical operations than the 148,259 they planned to deliver.
1.29
The number of FSAs has also increased, from 432,984 in 2008/09 to 487,512 in 2012/13.
Treating more patients in priority order
1.30
The Ministry is promoting the use of a new “acuity index” to help DHBs schedule patients for treatment. The index will involve dividing the number of days that each patient has already waited by the clinically appropriate maximum number of days they should wait. If the resulting score:
- is less than one, the patient is within the clinically appropriate time frame;
- equals one, the patient has waited for the maximum clinically appropriate time frame; and
- is greater than one, the patient has waited longer than the clinically appropriate time frame.
1.31
As a starting point for preparing theatre lists, patients with a score of one or higher should have the highest priority for treatment. However, other factors also influence how a theatre list is put together, such as the time needed to complete each operation and the availability of other needed resources.
1.32
While shorter waiting times are being phased in (see paragraph 1.21), it is difficult for DHBs to consistently ensure that patients are treated in priority order and for all patients to be treated within the clinically appropriate treatment time. We expect to see more consistent and improved performance in this area by 2015/16. By then, DHBs will also have made more progress in implementing nationwide prioritisation tools for high-volume surgery.
1.33
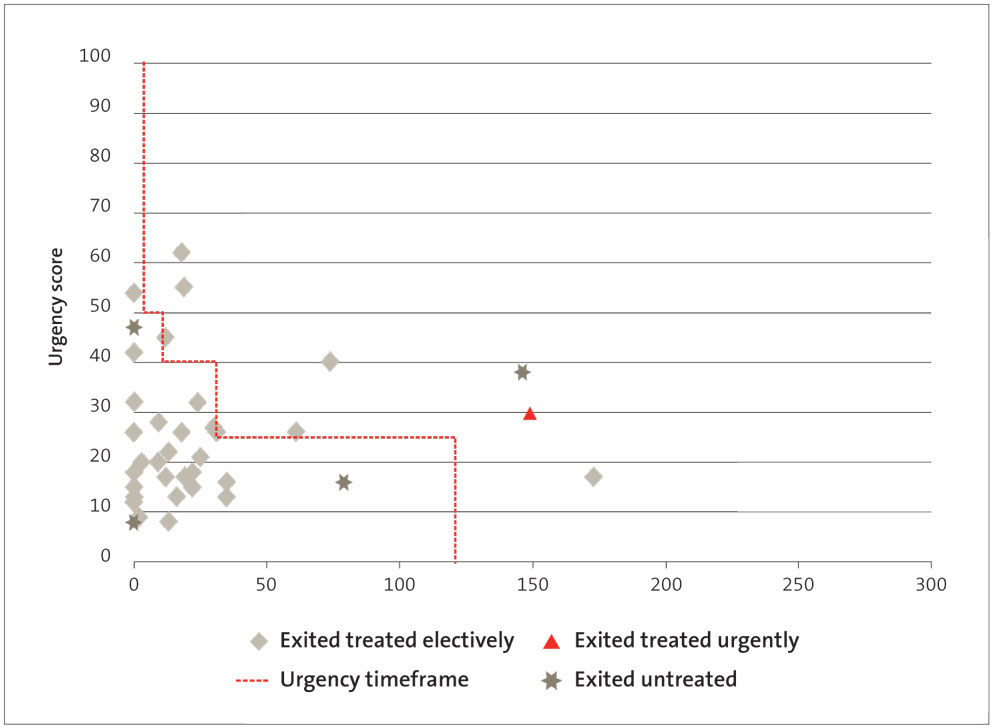
The Ministry produces scatter graph reports (such as Figures 3-7) that report on DHBs’ progress in treating patients in priority order. It shares these reports with DHBs.
1.34
In our 2011 report, we noted that there had been longstanding problems in ensuring that cardiac surgery patients were treated in a timely way. We said that we would report on progress in 2013.
1.35
Cardiac surgery is provided by five DHBs – Auckland, Waikato, Capital and Coast, Canterbury, and Southern. In May 2010, cardiac surgeons agreed to introduce a new urgency tool that prescribed a recommended time frame for treatment that matches each patient’s priority score. They have phased in their use of the tool since then.
1.36
The first full year’s worth of data is for 2012/13. The data shows that:
- Auckland DHB treated 73% of cardiac patients within the recommended time frame for their priority score;
- Waikato DHB treated 68% of cardiac patients within the recommended time frame for their priority score;
- Capital and Coast DHB treated 82% of cardiac patients within the recommended time frame for their priority score;
- Canterbury DHB treated 76% of cardiac patients within the recommended time frame for their priority score; and
- Southern DHB treated 76% of cardiac patients within the recommended time frame for their priority score.
1.37
Figures 3-7 show each of these DHBs’ performance for treating cardiac patients in priority order. The aim is that all the symbols would be below the red line shown on each graph. The red line represents the maximum recommended time frame for treatment for each priority score. (If more than one patient has the same score and waited the same amount of time to get treatment, it will show up as one symbol on the graphs.) The data for Figures 3-7 was provided by the Ministry.
Figure 3
Days waited for cardiac surgery by patient prioritisation score 2012/13, Auckland DHB
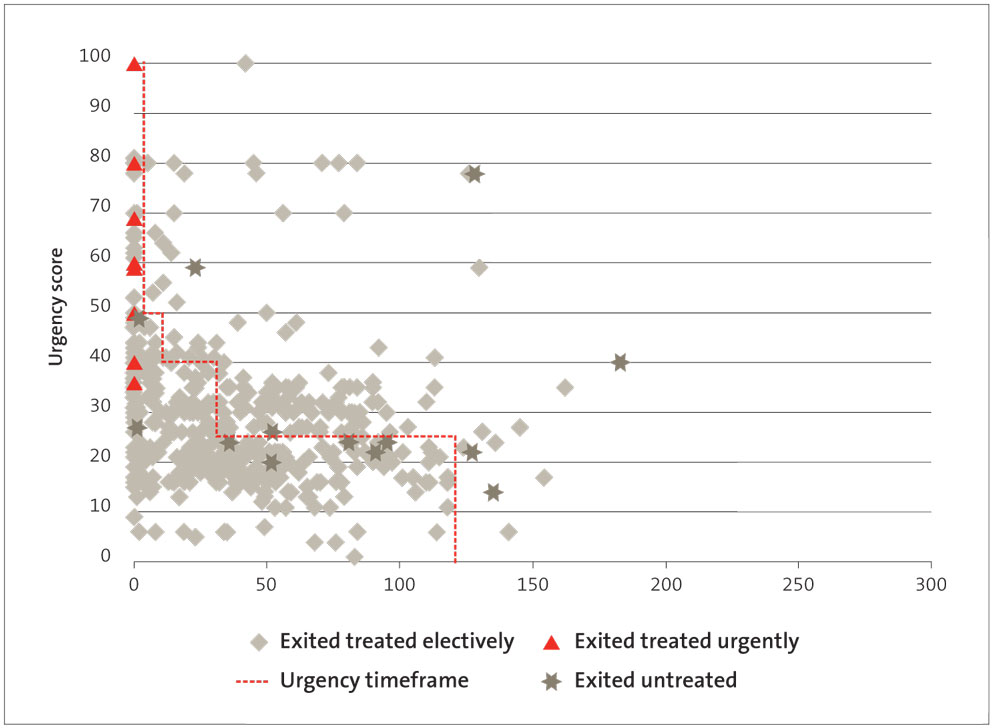
Figure 4
Days waited for cardiac surgery by patient prioritisation score 2012/13, Waikato DHB
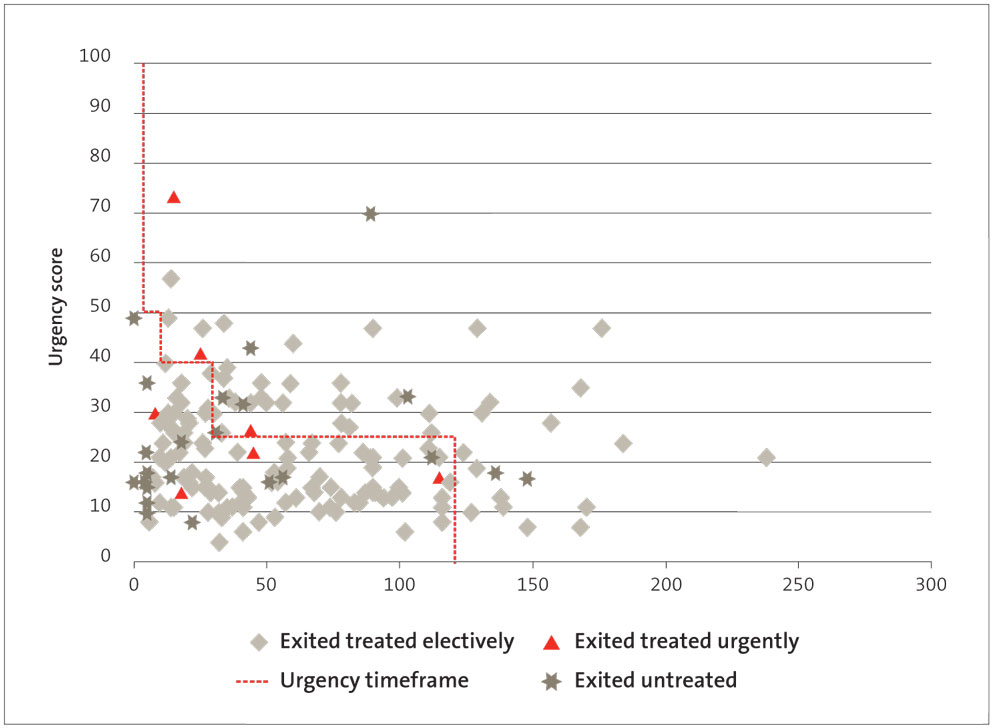
Figure 5
Days waited for cardiac surgery by patient prioritisation score 2012/13, Capital and Coast DHB
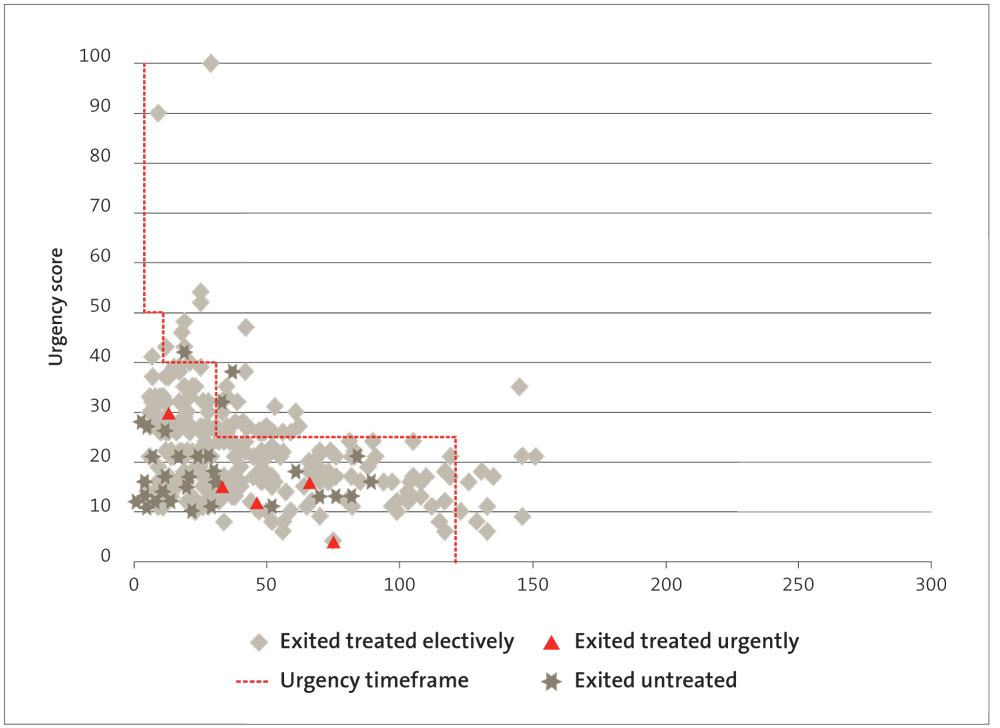
Figure 6
Days waited for cardiac surgery by patient prioritisation score 2012/13, Canterbury DHB
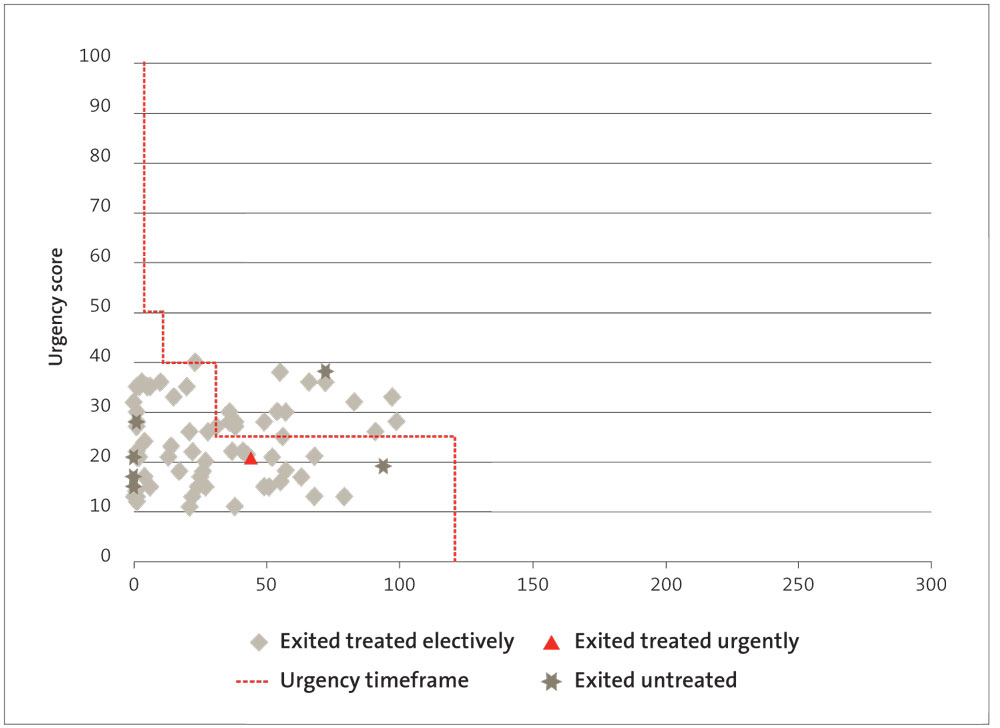
Figure 7
Number of days waited for cardiac surgery by patient prioritisation score 2012/13, Southern DHB
1.38
Figures 3-7 show that:
- Waikato and Southern DHBs treated patients urgently after the recommended time frame for treatment;
- all DHBs treated patients with high-priority scores (scores of 50 or higher) after the recommended time frame;
- all DHBs had one or more patients who “exited untreated” after the recommended time frame for treatment; and
- only Canterbury DHB treated all its patients within 120 days.
1.39
The Cardiac Network is pleased about the progress that has been achieved but is also aware that more progress is needed. This data provides a baseline on which to assess further improvements.
Quantifying the level of unmet need
1.40
For various reasons, some people might not have access to scheduled services that they would benefit from if more services were available. This is known as unmet need.1
1.41
Quantifying unmet need for scheduled services is not easy to do. There is no single method for quantifying it. Instead, a range of data is needed to get an idea of whether the quantity of services available is “about right”.
1.42
The Ministry and DHBs are making progress in a number of areas that, over time, should help to quantify unmet need. These are:
- improving equity of access to treatment between DHBs, so that each region has a similar level of access;
- introducing waiting times for selected diagnostic tests, so that access to the tests and any subsequent treatment is not delayed;
- measuring the time taken to treat patients from the time that they were first referred for an FSA, so that access to services is not delayed; and
- assessing changes in acute demand, which should reduce as the system for providing scheduled services becomes more efficient.
Improving equity of access
1.43
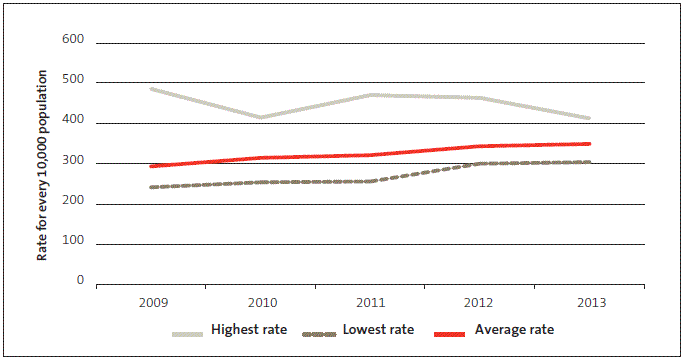
At a high level, equity of access2 can be assessed by comparing DHBs’ treatment rates (called a standardised intervention rate, or SIR). The aim is that each DHB will deliver a rate of scheduled services equivalent to its share of the population. Figure 8 shows that the gap between the DHBs with the highest and lowest SIRs for every 10,000 population narrowed between 2009 and 2013.
Figure 8
Standardised intervention rates for surgical treatment for every 10,000 population, 2009-13
Source: Ministry of Health.
Notes: The rates are rolling 12-month results for the year ending March. Data is sourced from the National Minimum Data Set and National Non Admitted Patient Collection.
Waiting times for diagnostic tests
1.44
The Ministry has introduced waiting time indicators for some diagnostic tests (coronary angiogram, colonoscopy, magnetic resonance imaging, and computed tomography). Previously, there was no national reporting of waiting times for diagnostic tests.
1.45
It takes time for the Ministry and DHBs to decide what data to collect on diagnostic tests and for all DHBs to report it consistently. To begin with, DHBs started reporting waiting times data from 1 July 2012. The data collected during 2012/13 was used to establish waiting time targets and indicators for 2013/14. The Ministry currently relies on each DHB consistently understanding the data that needs to be reported and accurately reporting it. The new National Patient Flow database, when it is implemented (see paragraph 1.46), will help the Ministry to have greater confidence in the quality of DHBs’ waiting times data for diagnostic tests. This is because the National Patient Flow database will provide further opportunities to identify any variations between DHBs.
Measuring the patient pathway from start to end
1.46
The Ministry has started a programme of work to enable waiting times to be measured from a patient’s first referral to a DHB to their last contact with the DHB for that referral. The new system is called National Patient Flow, which will be a new database. Over time, it will bring together data currently held in other databases3 and provide comprehensive information on waiting times for patients for medical, surgical, and diagnostic services for cancer and scheduled services (FSA and treatment). Data will also be collected on patients who were referred to DHBs but not provided with a scheduled FSA and/or treatment. This data is not currently collected. The Ministry appointed a senior project manager in March 2013 to lead this work.
1.47
At the same time, DHBs are carrying out work to improve the quality and consistency of referrals to DHBs for an FSA and/or treatment. Over time, this will reduce the number of referrals returned to general practitioners (GPs) because the GP provided incomplete information.
Assessing changes in acute demand
1.48
As noted in paragraph 1.41, knowing when “enough” scheduled services are provided is not straightforward. One “rough and ready” way is to compare the proportion of patients treated urgently and patients receiving scheduled services.
1.49
Some decrease in the demand for urgent treatment can be expected:
- when fewer patients who are scheduled for services are treated urgently;
- when doctors assessing inpatients use scheduled services prioritisation tools to decide whether those patients have higher priority than patients who have already been booked for treatment; and
- when GPs are confident that referrals to scheduled services will be handled in a timely way.
1.50
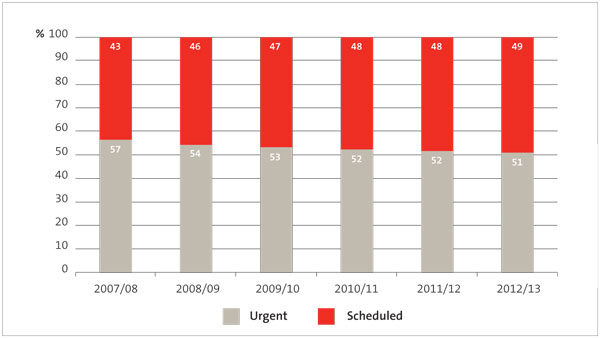
Figure 9 shows that from 2007/08 to 2012/13 patients treated urgently made up a decreasing proportion of all patients treated. This would appear to indicate that the system for provided scheduled services is becoming more effective, and more efficient because good organisation is necessary to ensure that more scheduled surgeries are delivered.
Figure 9
Proportion of surgical patients treated by surgery type, 2007/08 to 2012/13
Source: Ministry of Health.
Notes: Data for scheduled medical treatment is not included in this graph. Data from 2007/08 to 2011/12 was sourced from the National Minimum Data Set on 4 February 2013. Data for 2012/13 was sourced on 12 August 2013.
Assessing whether there have been unintended consequences of decreased waiting times
1.51
The Ministry was aware of a risk that adverse consequences could happen during the transition from six-month to four-month waiting times, and potentially in the longer term.
1.52
One risk was that the minimum priority scores for accepting patients for treatment (the thresholds) could increase and reduce access to scheduled services. To help prevent this, DHBs cannot reduce planned access, and the amount of surgery that DHBs are to deliver has been maintained or increased. Increases are targeted at DHBs whose current delivery is below their population share (see paragraph 1.43). This will gradually increase access to more consistent levels throughout the country.
1.53
The Ministry also monitors standardised intervention rates for surgical and medical FSAs, the number of patients treated by each surgical specialty, and – for selected procedures – the treatment rate for every 10,000 population (see paragraph 1.43).
1.54
The Ministry also introduced a range of performance reports to help DHBs to manage scheduled services. It shares these reports with DHBs.
1.55
To provide further assurance, the Director-General of Health convened an expert panel to:
- determine whether there were any unintended consequences for patient care of reduced waiting times; and
- consider whether there is a need for any additional guidance or support for DHBs to implement their strategies to meet waiting time goals.
1.56
The Ministry released the panel’s report in June 2013. The panel concluded that there was no evidence of adverse consequences for patient care. The panel made seven recommendations, which the Ministry has started to implement.
Appendix: Further information
The following table summarises other significant activities that are under way. These facilitate the achievement of the six priority areas.
| June 2011
|
The Ministry published the report, National Cardiac Surgery Update: and the formation of the New Zealand Cardiac Network. Among other things, the report comments on improved waiting times and equity. |
| October 2011 | The Ministry provided DHBs with updated guidance documents for managing patients included in the National Booking Reporting System for elective treatment. We consider that these guidelines (which include detailed flow diagrams) are an improvement over the ones that they replaced. This is partly because they provide advice on what not to do, as well as what to do. In our view, the guidelines should help to improve national consistency for patients. The Ministry consolidated its information on elective services on its website and provided clearer information about how the system works. This includes a flow diagram of the patient pathway showing the basic steps in the elective care process. This information is clearer and easier to find than when we did our audit. |
| April 2012 | The Ministry published a toolkit to help DHBs improve quality, increase access, and reduce waiting times for elective patients. |
| May 2012 | The Ministry and DHBs established a representative group of DHB chief operating officers to identify common issues and obstacles to meeting the maximum four months’ time frame, and agreeing options and solutions. This group is supported by the Ministry and is expected to disband in February 2015. |
| June 2012 | An article published in the New Zealand Medical Journal summarised actions to improve access to cardiac surgery and outcomes. It identified further opportunities for improvement. |
| 2012/13 | External evaluation of projects funded through the Elective Services Productivity and Workforce Programme were completed. The rest of the projects will be evaluated once they complete their contract period. Any recommendations have been included in the Ministry’s work programme. The Annual Electives Forums were held in 2012 and 13. The Inaugural Annual Radiology Service Improvement Forum was held in 2013. These events support sector stakeholder engagement and enable lessons learned to be shared. |
| June 2013
|
The Ministry released two support documents to DHBs:
|
| Late 2013 (estimated) | The Ministry is preparing an Electives Resource pack for DHBs. The Ministry will bring together best practice advice from international and local sources. |
| 2013/14 | The National Health Board’s Electives team is leading expert reference groups for General Surgery and Orthopaedics. The expert reference groups have developed advice on additional support that could be provided to DHBs to reduce waiting times for elective patients. Both groups identified the need for more shared information being available to clinicians and managers, and for readily accessible advice on good practice. The groups have developed Service Assessment Templates and Services Improvement Checklists for their respective specialties. A national programme is being launched to promote adoption of Enhanced Recovery After Surgery principles for patients with fractured neck of femur, and patients undergoing total hip or knee joint replacements. |
Source: Ministry of Health.
1: DHBs are expected to offer scheduled services to patients with the highest needs and ability to benefit from treatment relative to other patients within the resources available. This means that some patients who would receive benefit from treatment are not necessarily offered services.
2: Equity of access means that patients with a similar level of need and ability to benefit from treatment will have similar access to scheduled services, regardless of where they live.
3: These databases include the National Minimum Data Set, National Non Admitted Patient Collection, National Booking Reporting System, and New Zealand Cancer Registry.
