Part 3: Presenting service and cost performance information
Current service and cost performance reporting
3.1
Local authorities usually complied with the reporting requirements of Part 3 of Schedule 10 of the LGA. If they did not, we referred to the non-compliance in our audit report.
3.2
We found improvements in the quality of local authorities' SSPs during the period under review. Local authorities have made considerable progress in presenting their non-financial performance measurement in 2009/10 compared with reports from earlier years (2003/04 to 2008/09). The earlier reports often had information of very limited usefulness for assessing and evaluating performance. The progress reflects improvements in local authorities' performance frameworks, as included in their 2009-19 LTPs and first reported against in their 2009/10 annual reports.
3.3
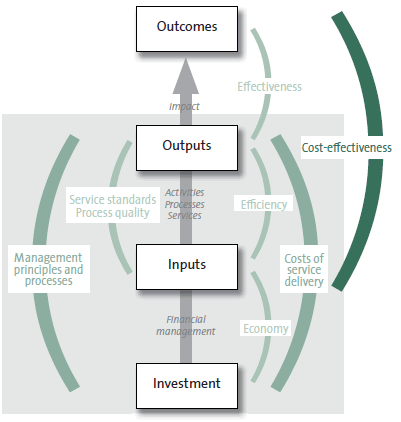
As noted in Part 2, a local authority measures the cost of its service delivery by assessing whether it is providing its goods and services economically and efficiently. Therefore, measures of economy (the relationship between investment and inputs) and efficiency (the relationship between inputs and outputs) form the foundation of performance analysis.
3.4
Figure 3 highlights the economy and efficiency measures.
Figure 3
An outcomes-based model, indicating areas of output (goods and services) reporting
3.5
Annual reports in the later years – particularly the 2009/10 annual reports – showed better performance information in the SSP. The Society of Local Government Managers provided extensive guidance for developing the 2009-19 LTCCP, and the 2009/10 annual plans and 2009/10 annual reports have been audited under the Auditor-General's Auditing Standard 4 (Revised): The audit of service performance reports.10
3.6
For the local authorities' annual reports that were analysed for this discussion paper, we found two main areas of improvement:
- measuring what matters to the ratepayers and the community; and
- explaining performance results.
Measuring what matters
3.7
The better annual reports showed a movement between 2003/04 and 2009/10 away from transactional process or activity-type measures (which focus on completing individual processes, tasks, or reports) toward outcome-based, impact-based, and service-based measures that could be used to understand the effectiveness of the local authorities' operations.
3.8
The performance measures that a local authority chooses should provide a balanced picture of the important aspects of the levels of service that it provides and the purpose of that activity. We have noted previously:
In selecting performance measures to report, entities should consider the characteristics of performance that:
- are of greatest importance to [ratepayers and the community];
- reflect the financial significance of the activity; and
- reflect both the objectives for carrying out the activity and any (external or internal) risks needed to be managed in achieving those objectives. 11
3.9
Alongside the shift in the types of measures, some local authorities reduced the number of performance measures included in their performance framework. The resulting performance measures focused on measuring aspects that were most important for understanding service quantity and standards. For example, Bay of Plenty Regional Council reduced the number of performance measures from 211 in its 2008/09 annual report to 67 in its 2009/10 annual report.
3.10
Figures 4 and 5 illustrate the change in both the number and nature of the performance measures between annual reports for Tasman District Council and Bay of Plenty Regional Council.
Figure 4
Sample of performance measures for selected activities from Tasman District Council's annual reports
| Activity | Historic measures* | Current measures** |
|---|---|---|
| Water supply | Council water asset management plan (AMP) adequately forecasts growth and includes plans to provide infrastructure to adequately service new development areas. Council will operate all water supply activities in a sustainable manner and in accordance with legislation, District Plans and resource consents. |
Percentage of supply that meets minimum pressure requirements. Percentage of water tested compliant with Drinking Water Standards New Zealand (DWSNZ). |
| Wastewater | Public outreach for community involvement has occurred. 50% of pump stations have telemetry to allow automatic communication of failures. Record any properties that are unable to connect to the wastewater systems by gravity. |
Annual overflows per kilometre of sewer. Number of complaints relating to odour or noise. Number of overflows that cause beach closures or shellfish-gathering bans. |
* Source: 2007/08 and 2008/09 annual reports.
** Source: 2009/10 annual report.
Figure 5
Sample of performance measures for selected activities from Bay of Plenty Regional Council's annual reports
| Activity | Historic measures* | Current measures** |
|---|---|---|
| River control and flood protection | Compliance with maintenance and capital works operations programmes. Long-section and cross-section surveying of stop banks is carried out every five years. All pumps are inspected not less than six-monthly. |
No failure of flood protection schemes below specified design levels. |
| Air | Monitoring trends in the levels of applicable contaminants covered by New Zealand Ambient Air Quality Guideline. Monitor the efficiency and effectiveness of provisions in the Air Plan every five years. |
Exceedences of Particle Matter 10. |
* Source: 2007/08 and 2008/09 annual reports.
** Source: 2009/10 annual report. Note exceedences refers to the instances of particle matter 10 being exceeded.
Explaining performance results
3.11
The better annual reports provided high-level summaries of performance in the mayor's or chief executive's introduction at an overall local authority level or in the SSP at a group of activity level. We found that these annual reports supplemented their commentary with graphs, diagrams, and other illustrations to clearly highlight the local authority's performance. Some local authorities provided more useful commentary than others on variances against financial and performance expectations, and performance compared with previous years. The 2009/10 annual reports were especially good at this compared with earlier years' annual reports.
3.12
Figure 6 shows how Bay of Plenty Regional Council summarised performance against its performance measures as a whole.
Figure 6
Bay of Plenty Regional Council's statement on its achievement against its performance measures
| We measure how we are going through key performance indicators. We believe we have performed well against our 67 key performance indicators (KPI). At the end of the financial year 76 percent of our indicator targets (51) were on track. We were behind schedule on 22 percent (15) of these, and significantly behind on just one of our target indicators (2 percent).* |
| Green lights signify that all projects that contribute to that KPI have been completed satisfactorily. Amber lights indicate a target that was not reached but was within 20 percent of being met. Red lights are used when we are more than 20 percent behind target. This indicates a project or programme is significantly behind schedule. |
| Our 2010 annual Environmental Enhancement Fund target for completed projects was significantly behind schedule. Our application round was brought forward to better suit planting timeframes, but this required staff resources to be diverted from ensuring recipients completed projects on time. As a result only 26 percent of projects were completed in the required timeframe. Systems are in place to ensure this is not repeated in future years. Further discussion on our key performance indicators can be found under each activity. |
* Source: Bay of Plenty Regional Council, 2009/10 annual report, page ix.
3.13
Although the general picture was one of improvement, the quality of activity performance reporting varied greatly across the local authorities reviewed. The common features that were still prevalent in the performance frameworks included:
- using performance measures that assessed "processes and transactions" rather than the services delivered;
- using a limited range of measures that assessed quality of service delivery, with performance measures relying heavily on customer satisfaction surveys;
- using a large number of performance measures that made it difficult to see the big picture performance of the local authority and establish service trends and achievements; and
- providing performance information that was not presented in a way that was very accessible for readers.
Opportunities for improvement
3.14
We identified four areas where local authorities could make improvements to their annual reports, and we have included examples from annual reports to show the sort of improvements that could be made in these areas:
- trend analysis;
- showing outcome progress;
- analysing cost-effectiveness; and
- providing greater explanation and commentary.
Trend analysis
3.15
Most local authorities provided prior-year comparative information, but we found that they provided little trend analysis highlighting how performance had changed over time. This makes it difficult to determine whether local authorities' activities are moving in the right direction and are having the desired result.
3.16
Instead of trend information, readers of SSPs are presented with a snapshot of the current year's performance against target. This provides no information on whether operations are improving or deteriorating. For example, a customer satisfaction rating of 80% for a certain service may look very impressive on a standalone basis and against a target of 50%, but is less impressive when compared with the previous year's rating of 95%.
3.17
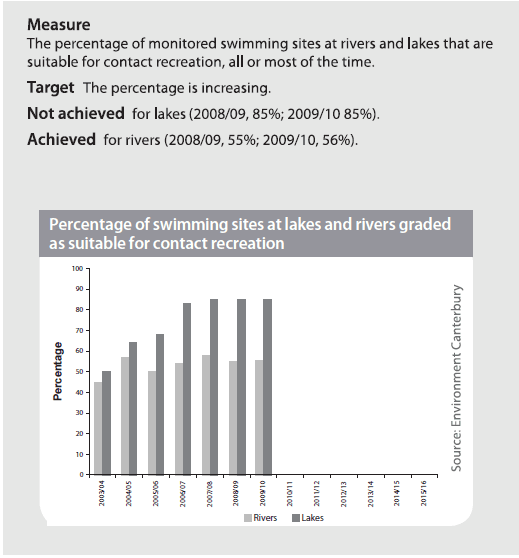
Environment Canterbury showed how performance changed over a number of years at an activity level, presenting the current year result alongside results for the previous two years. Highlighting trends in performance enables readers to assess the effect of a local authority's services on performance. Figure 7 is an example of how Environment Canterbury discloses several years of performance information.
Figure 7
Example of how Environment Canterbury discloses several years of performance information – improving recreational water quality at swimming sites
Source: Environment Canterbury, 2009/10 annual report, page 68.
Showing outcome progress
3.18
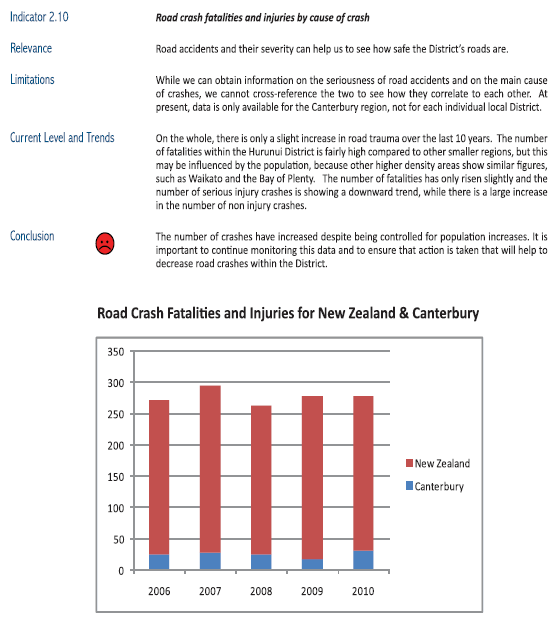
Hurunui District Council sets out its progress against its well-described outcome measures and shows long-term trends using graphs and other helpful graphics as well as providing helpful commentary. Figure 8 is an example of how Hurunui District Council uses a range of formats to show trends.
Figure 8
Example of how Hurunui District Council uses various graphics to show trends
Source: Hurunui District Council, 2009/10 annual report, pages 37 and 38.
Analysing cost-effectiveness
3.19
We found there was very little analysis of, or commentary on, cost-effectiveness in the annual reports. This means that there is limited visibility about the value ratepayers and the community receive from expenditure and in relation to standards and quality of service delivery.
3.20
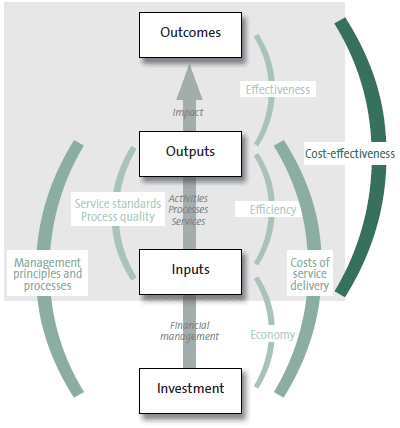
Figure 9 highlights cost-effectiveness, which is made up of efficiency and effectiveness measures – that is, the relationship between inputs, outputs, and outcomes.
Figure 9
An outcomes-based model, indicating areas that make up cost-effectiveness measures
3.21
In the following examples, we have compiled information from several years of reported annual report results to show how inferences about cost-effectiveness can be made (and presented). We acknowledge that there will be other factors relevant to interpreting the performance results such as strategies, programmes, and resources. However, the explanation of these other factors was commonly not disclosed in the annual reports.
3.22
The examples set out in Figures 10, 11, and 12 show that an increase in expenditure appears to have resulted in an increase in efficiency or effectiveness of service delivery. Including such analysis in annual reports would be helpful to readers to clearly see the results of council services and the impact these services have or have not had on outcomes.
3.23
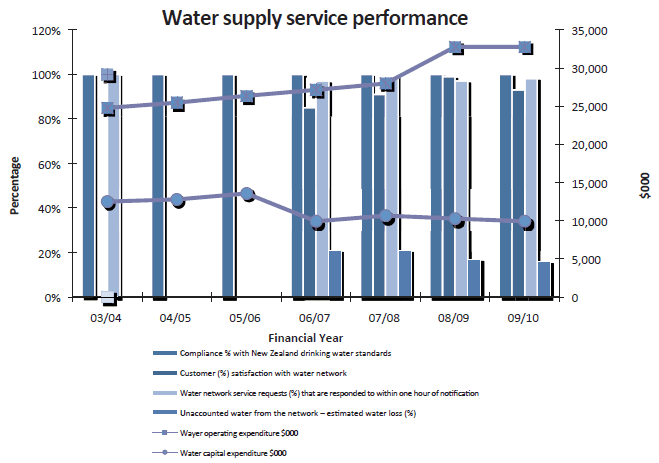
In Figure 10, we have graphed Wellington City Council's water supply expenditure and performance results so we can see the trends over the last seven years.12
Figure 10
Wellington City Council's water supply expenditure* and performance results over seven years show the efficiency aspect of performance**
3.24
Figure 10 shows that there has been a steady increase in water-supply operating expenditure over the seven years, with a steeper increase between 2007/08 and 2008/09. The increase in operating expenditure appears to have had a positive effect on customer satisfaction with the network and reduced the amount of unaccounted water loss. Wellington City Council disclosed that:
During the year, active leak detection programmes were undertaken on the public network, including work in Johnsonville, Newtown, Ngaio, Churton Park, Tawa, and within the CBD. A number of significant leaks on private residences were also identified and fixed during the year.
The pressure reduction trial in Mt Victoria and Roseneath should reduce the number of bursts and the effects of any leaks. 13
This is a good example of how graphing performance results over a longer-term period can tell the performance story.
3.25
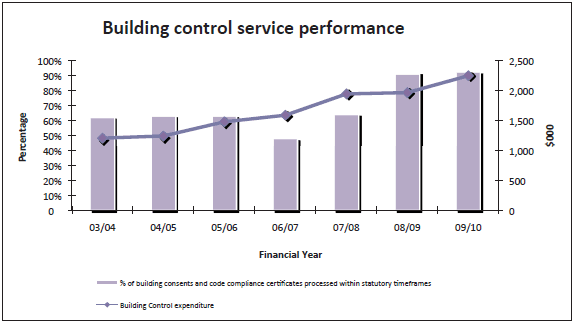
In Figure 11, we have put together Tasman District Council's building control service performance and operating expenditure for seven years. This provides another example of how to tell a performance story.
Figure 11
Tasman District Council's building control service over seven years shows the efficiency aspects of performance
3.26
Figure 11 shows a good correlation between an increase in expenditure and an increase in the percentage of consents processed within statutory timeframes. Tasman District Council could further improve the performance story by including information such as the cost per consent for types of consents, the total value of consents processed in each financial year, and consideration of the outcome of building control services and how this might be assessed.
3.27
Environment Canterbury included a range of service delivery and impact measures within its pest control activity. We have created the following graph using information from this council's annual reports to show service performance trends over seven years in Figure 12.
Figure 12
Environment Canterbury's pest control service performance and outcomes*
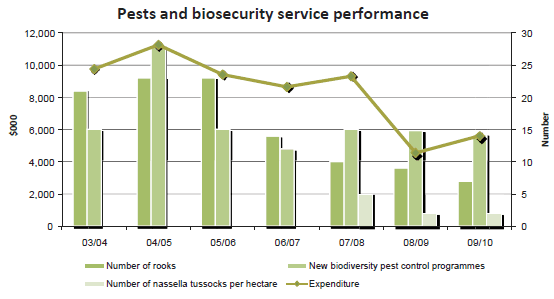
* Environment Canterbury did not measure and report the number of new biodiversity pest control programmes from 2003/04 to 2006/07.
3.28
Environment Canterbury's pest control activity performance appears to be a largely positive story. Despite significant drops in spending from 2004/05 to 2008/09, Figure 12 shows that pest control appears to be heading in the right direction. The programmes and initiatives often do not produce results till subsequent years. Although Environment Canterbury has not pulled together its performance results by providing a graph like Figure 12 in its annual report, we found that it has provided a good overview of its progress on limiting the effect of pests by operating a three-tier pest control programme.14
Providing greater explanation and commentary
3.29
The relationship between expenditure and performance measures is not a simple or proportional one, and many factors play a part. Therefore, the commentary accompanying the measures is important.
3.30
In general, we found that there was very little commentary to support the performance measurement framework. Telling the story of performance achievement and trends in the annual report is an important part of giving the reader a holistic perspective on a local authority's operations.
3.31
Local authorities should consider providing explanatory comment where actual performance is materially different to the target set (either above or below) or to the performance trend from previous years. Such commentary should set out the factors and events necessary to understanding the performance results and the plans in place to make any changes to performance desired in the future. Although the following examples explained performance achievement and the impact it has had on operations, they could be improved by explaining how the issues could be addressed or responded to.
Figure 13
Environment Canterbury's commentary on processing of applications for resource consent
| Continued high demand for consents from water, dairy and subdivision related activities, coupled with increased numbers of notifications and hearings in water resource constrained areas, and some large individual applications, has resulted in many consent applications across all portfolios not being able to be completed within statutory timeframes.* |
* Source: Environment Canterbury, 2007/08 annual report, page 16.
Figure 14
Wellington City Council's commentary on library activity
| We have experienced a notable shift in usage over the last two years. From survey results, fewer residents (down 6%) are making use of the library facilities and actual issues have also declined … Conversely, library website visitor sessions have increased by 13% from 1,294,371 in 2006/07 to 1,465,637 in 2007/08. This result suggests that users are shifting away from physical visits to accessing the library's web facilities.* |
* Source: Wellington City Council, 2007/08 annual report, page 59.
| Recommendation 1 |
|---|
| We recommend that local authorities identify services and results (costs, outputs, impacts, and outcomes) that would benefit from longer-term (5 to 10 years) trend analysis and report that analysis, supported with commentary, in their annual reports. |
| Recommendation 2 |
|---|
| We recommend that local authorities analyse and evaluate their service performance, cost of service, and impact and outcome results to assess and report on cost-effectiveness. |
10: Auditors were required to attest to whether the statement of service performance fairly reflects actual service performance for the year.
11: Controller and Auditor-General (2008), The Auditor-General's observations on the quality of performance reporting, paragraph 6.43, which is available at www.oag.govt.nz.
12: We have left out some performance results, such as water consumption (because there did not appear to be any related service delivery performance measure), and other results that Wellington City Council started reporting only for 2009/10.
13: Wellington City Council, 2009/10 annual report, page 35.
14: Environment Canterbury, 2009/10 annual report, page 32.
page top