Part 3: Land and population issues in specific regions
Wāhanga Tuatoru – Ko ngā take e pā ana ki te whenua me te nuinga tāngata o tahi rohe tūturu
Te Tai Tokerau
Māori land in Te Tai Tokerau
3.1
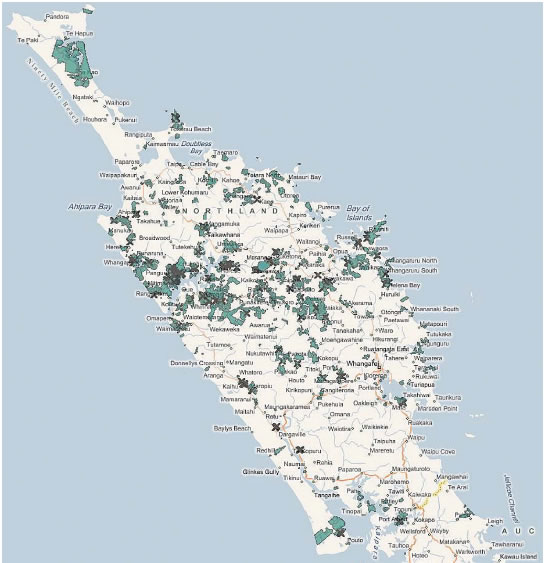
There are 144,491 hectares of Māori land in Te Tai Tokerau. This represents 11.38% of all land in the region. Figure 5 shows where the larger land blocks in Te Tai Tokerau are. Figure 6 sets out land by local authority.
Figure 5
Māori land in Te Tai Tokerau
Source: Te Puni Kōkiri, Māori Land Online.
Figure 6
Māori land in each local authority area of Te Tai Tokerau
| Local authority | Size (and proportion) of Māori land | Land description |
|---|---|---|
| Far North District Council | 130,000 hectares (17%) | Māori land is heavily concentrated around Hokianga and the Western ward, with significant blocks of land near the growth area of Bay of Islands/Kerikeri. |
| Kaipara District Council | 9,600 hectares (3%) | 230 blocks of Māori land, mostly around Waipoua, Kaihu, Pouto, Ounawhao, Tinopai, and Oruawharo. |
| Whangarei District Council | 11,000 hectares (4%) | Māori land is generally along the coast and clustered in rural areas. |
Māori population of Te Tai Tokerau
3.2
An estimated 50,800 people in Northland were Māori in 2011, using projections based on the number of people who identified as Māori in the 2006 Census. The Māori population in Te Tai Tokerau is expected to grow relatively little. Figure 7 sets out the projected population increase for each local authority area.
Figure 7
Māori population and growth trends for each local authority area of Te Tai Tokerau (using 2006 Census data)
| Local authority | Māori population (% of population) | Population growth | Expected Māori population growth |
|---|---|---|---|
| Far North District Council | 25,200 (43%) |
The Māori population is expected to increase by 1000 people (4% of current Māori population) by 2021. The total population is expected to increase by 2.5% to 60,500 by 2021. | Low |
| Kaipara District Council | 4,400 (23%) |
The population is expected to remain stable. | Low |
| Whangarei District Council | 21,200 (26%) |
The Māori population is expected to increase by 3700 (or 17.5% of the current Māori population) by 2021. The total population is expected to increase 8% to 87,700 by 2021. | Moderate |
3.3
Not all of these people will whakapapa to the local area, and they will not all have shares in local Māori land (nor will all those who do come from the local area). Figure 8 shows the number of Māori from the region's iwi, as an approximation of how many Māori might be "eligible" for housing on Māori land in Te Tai Tokerau.
Figure 8
Te Tai Tokerau iwi and their population resident in Te Tai Tokerau (using 2006 Census data)
| Iwi | Population resident in region | Population resident elsewhere in New Zealand |
|---|---|---|
| Te Aupouri | 2412 | 9333 |
| Ngati Kahu | 2628 | 8313 |
| Ngati Kuri | 1899 | 5757 |
| Ngāpuhi | 24,909 | 122,214 |
| Te Roroa | 507 | 1170 |
| Ngāpuhi ki Whaingaroa-Ngati Kahu ki Whaingaroa | 615 | 1746 |
| Te Rarawa | 4458 | 14,892 |
| Ngai Takoto | 345 | 771 |
| Ngati Wai | 1830 | 4866 |
| Ngati Whatua | 3324 | 14,721 |
| Te Uri o Hau | 399 | 1074 |
Māori household incomes in Te Tai Tokerau
3.4
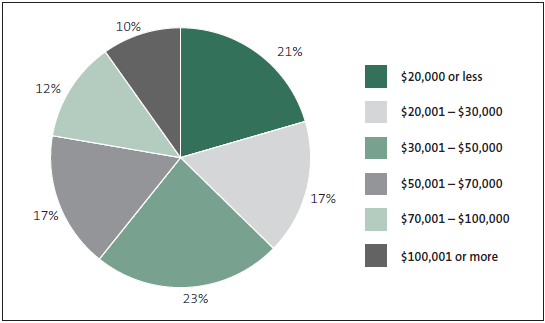
In Te Tai Tokerau, 61% of Māori households have a yearly income of less than $50,000, and 37.5% of Māori households have a yearly income of less than $30,000. Figure 9 shows the proportion of Māori households by income bracket.
Figure 9
Incomes of Māori households in Te Tai Tokerau (using 2006 Census data)
Note: "Not stated" responses have been removed from this pie chart.
Particular challenges and features of Te Tai Tokerau
3.5
The challenges and features of Te Tai Tokerau include:
- Infrastructure – the availability of reticulated water and wastewater services is limited in some areas. Because of low population densities in the rural areas, it is relatively more expensive for local authorities to provide these services than in other local authorities, which has led to higher development contributions (fees paid to local authorities).
- Employment – Te Tai Tokerau has struggled with the recession. As well, most of the new employment opportunities are in the eastern ward, but many Māori, and most Māori land, are in the western ward.
- Building skills and trade training – the region has difficulty recruiting and retaining the skilled tradespeople needed for building houses. This, in turn, can delay building or make building more expensive.
- State of rural housing stock – poorly maintained rural housing (including housing on Māori land) contributes to the need for affordable housing interventions. Some of these houses require total replacement.
Tāmaki Makaurau
Māori land in Tāmaki Makaurau
3.6
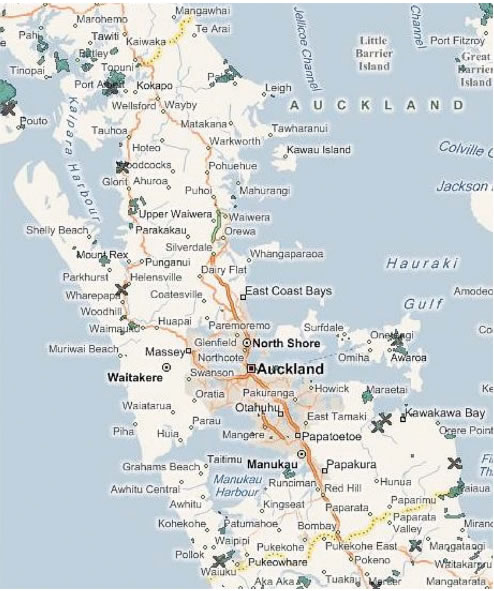
There are 4390 hectares of Māori land in the wider Tāmaki Makaurau region. This represents about 0.88% of all land in the region. Figure 10 shows where the larger land blocks in the Tāmaki Makaurau region are. Figure 11 sets out land by local authority.
Figure 10
Māori land in Tāmaki Makaurau
Source: Te Puni Kōkiri, Māori Land Online.
Figure 11
Māori land in each local authority area of Tāmaki Makaurau
| Local authority | Size (and proportion) of Māori land | Land description |
|---|---|---|
| Auckland Council | 4390 hectares (0.88% ) | The little Māori land remaining in the region is fragmented into small, isolated blocks. This means that there is limited land available for development, with the main option being to build upwards. In Auckland City, there are a few parcels of land that would be suitable for housing development. In Manukau, there are a few parcels of undeveloped Māori land, mainly in rural and coastal areas. |
Māori population of Tāmaki Makaurau
3.7
An estimated 174,300 people in Tāmaki Makaurau were Māori in 2011, using projections based on the number of people who identified as Māori in the 2006 Census. The Māori population in Tāmaki Makaurau is expected to grow relatively little in the former Auckland City Council area, but moderately in the former Manukau City area (these two areas are where we carried out our fieldwork in Tāmaki Makaurau). Figure 12 sets out the projected population increase for each former local authority.
Figure 12
Māori population trends in each local authority area of Tāmaki Makaurau (using 2006 Census data)
| Local authority | Māori population (% of district) | Population growth | Expected Māori population growth |
|---|---|---|---|
| Former Auckland City Council | 36,500 (8%) |
The Māori population is expected to increase by 3000 people (8% of current Māori population) by 2021. The former Auckland City's population is expected to increase by 64,700 people (14% of current population) by 2021. |
Low |
| Former Manukau City Council | 59,200 (15%) |
The Māori population is expected to increase by 10,300 people (17% of current Māori population) by 2021. The former Manukau City's population is expected to increase 19% to 457,600 by 2021. |
Moderate |
3.8
Not all of these people will whakapapa to the local area, and they will therefore not all have shares in local Māori land (nor will all those who do come from the local area). Figure 13 shows the number of Māori from the region's iwi, as an approximation of how many Māori might be "eligible" for housing on Māori land in Tāmaki Makaurau.
Figure 13
Tāmaki Makaurau iwi and their population resident in Tāmaki Makaurau (using 2006 Census data)
| Iwi | Population resident in region | Population resident elsewhere in New Zealand |
|---|---|---|
| Ngati Whatua | 7152 | 14,721 |
| Te Kawerau | 81 | 123 |
| Tainui | Insufficient information | Insufficient information |
| Ngati Paoa | Insufficient information | 3375 |
| Ngati Rehua | Insufficient information | Insufficient information |
Māori household incomes in Tāmaki Makaurau
3.9
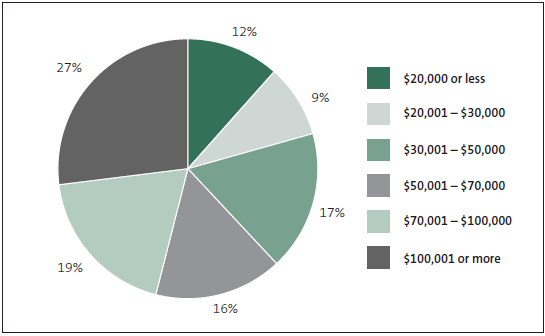
In Tāmaki Makaurau, 38% of Māori households have a yearly income of less than $50,000, and 21% of Māori households have a yearly income of less than $30,000. Figure 14 shows the proportion of Māori households by income bracket.
Figure 14
Incomes of Māori households in Tāmaki Makaurau (using 2006 Census data)
Note: "Not stated" responses have been removed from this pie chart.
Particular challenges and features of Tāmaki Makaurau
3.10
The challenges and features of Tāmaki Makaurau include:
- Within Auckland City, there is very little unused land (of any sort) available for "greenfield" housing development. This means that, although there is relatively little Māori land, it is still important for improving the housing situation.
- Because of the scarcity of land for housing compared with demand, single-storey relocatable houses are an inefficient use of the available land. This poses a challenge for people wanting to use programmes that require houses to be relocatable (see Part 6).
- The significant area of Māori freehold land at Orakei is well placed for increasing the supply of housing for Orakei beneficiaries. However, current government programmes may not be enough to match the aspirations for developing that land.
Tauranga Moana – Mataatua
Māori land in Tauranga Moana – Mataatua
3.11
There are 337,971 hectares of Māori land in the Tauranga Moana – Mataatua region. This represents 27.58% of all land in the region. Figure 15 shows where the larger Māori land blocks are in Tauranga Moana – Mataatua. Figure 16 sets out land by local authority.
Figure 15
Māori land in Tauranga Moana – Mataatua
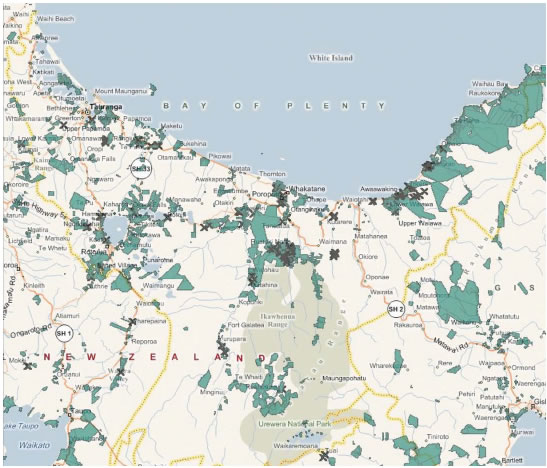
Source: Te Puni Kōkiri, Māori Land Online.
Figure 16:
Māori land in each local authority area of Tauranga Moana – Mataatua
| Local authority | Size (and proportion) of Māori land | Land description |
|---|---|---|
| Rotorua District Council | 57,528 hectares (22%) | The Council reports that most Māori land is in bush-type blocks. |
| Tauranga City Council | 1,965 hectares (14.6%) |
79 hectares of the Māori land is zoned commercial/industrial, 73 hectares conservation/green belt, 181 hectares papakāinga/marae, 1442 hectares rural/rural residential, and 189 hectares urban/residential. |
| Western Bay of Plenty District Council | 20,178 hectares (9.5%) |
Less than 1 hectare of the Māori land is zoned commercial/industrial, 94 hectares conservation/green belt, 150 hectares papakāinga/marae, 19,835 hectares rural, 94 hectares urban/residential, and 4 hectares is zoned other. |
| Whakatane District Council | 54,614 hectares (13%) |
Māori population of Tauranga Moana – Mataatua
3.12
An estimated 78,700 people in Tauranga Moana – Mataatua were Māori in 2011, using projections based on the number of people who identified as Māori in the 2006 Census. The Māori population in Tauranga Moana – Mataatua is expected to grow at variable rates. For Tauranga City, the rate of growth is expected to be relatively high. For Rotorua district, the rate of growth is expected to be relatively low. Figure 17 sets out the projected population increase for each local authority.
Figure 17
Māori population trends in each local authority area of Tauranga Moana – Mataatua (using 2006 Census data)
| Local authority | Māori population (% of the district) | Population growth | Expected Māori population growth |
|---|---|---|---|
| Rotorua District Council | 25,800 (37%) |
The Māori population is expected to increase by 2000 people (8% of current Māori population) by 2021. The total population is expected to grow 1.3% to 70,100 by 2021. |
Low |
| Tauranga City Council | 20,200 (17%) |
The Māori population is expected to increase by 4900 people (24% of current Māori population) by 2021. The total population is expected to grow by 16.5% to 136,500 by 2021. |
High |
| Western Bay of Plenty District Council | 8300 (18%) |
The Māori population is expected to increase by 1200 people (14% of current Māori population) by 2021. The total population is expected to grow by 11.7% to 51,500 by 2021. |
Moderate |
| Whakatane District Council | 14,800 (43%) |
The Māori population is expected to increase by 700 people (5% of current Māori population) by 2021. The total population is expected to decline marginally to 34,300 by 2021. |
Low |
3.13
Not all of these people will whakapapa to the local area, and they will therefore not all have shares in Māori land (nor will all those who do come from the local area). Figure 18 shows the number of Māori from the region's iwi, as an approximation of how many Māori might be "eligible" for being housed on Māori land in Tauranga Moana – Mataatua.
Figure 18
Tauranga Moana – Mataatua region iwi and their population resident in Tauranga Moana – Mataatua (using 2006 Census data)
| Iwi | Population resident in region | Population resident elsewhere in New Zealand |
|---|---|---|
| Ngaiterangi | 5079 | 12,201 |
| Ngai Tuhoe | 10,860 | 32,670 |
| Ngati Ranginui | 4071 | 7644 |
| Ngati Manawa | 963 | 1938 |
| Ngati Pukenga | 726 | 1785 |
| Ngati Whare | 5049 | 1281 |
| Ngati Rangitihi | 762 | 1536 |
| Whakatohea | 5049 | 12,069 |
| Ngati Tuwharetoa | 5151 | 34,674 |
| Ngai Tai | 900 | 2316 |
| Ngati Awa | 6780 | 15,258 |
Māori household incomes in Tauranga Moana – Mataatua
3.14
In Tauranga Moana – Mataatua, 55% of Māori households have a yearly income of less than $50,000, and 32% of Māori households have a yearly income of less than $30,000. Figure 19 shows the proportion of Māori households by income bracket.
Figure 19
Incomes of Māori households in Tauranga Moana – Mataatua (using 2006 Census data)
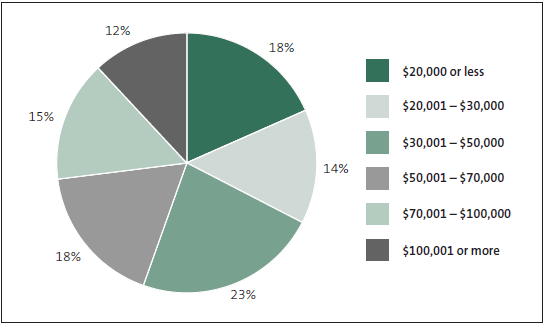
Note: "Not stated" responses have been removed from this pie chart.
Particular challenges and features of Tauranga Moana – Mataatua
3.15
The challenges and features of Tauranga Moana – Mataatua include:
- Tauranga and Whakatane have a high concentration of Māori land around their periphery. To grow, they will need to increase the development of Māori land, including for housing. Population growth is expected, particularly in Tauranga.
- In the past, one local authority has built infrastructure expecting a planned development to proceed. Because it did not, the local authority is now skeptical about the value of supporting these developments.
- The New Zealand Transport Authority (NZTA) is reluctant to allow additional junctions on state highways because they reduce the speed with which people can travel. A number of state highways bisect blocks of Māori land. Difficulties in connecting to the road network make it more difficult to develop these blocks for housing.
- Due to the geothermal activity around Rotorua, some Māori land lacks the strength to support the foundations of larger developments. In other local authorities, land is situated where there are flood risks or soft soil. The local authorities, not unreasonably, are reluctant to allow building to proceed in these areas.
Ōtautahi and Waimakariri
Māori land in Ōtautahi and Waimakariri
3.16
There are 76,924 hectares of Māori land in the region the Māori Land Court calls Te Waipounamu. This includes Ōtautahi and Waimakariri as well as most of the rest of the South Island. Figure 20 shows where the larger land blocks in Ōtautahi and Waimakariri are.
Figure 20
Māori land in Ōtautahi and Waimakariri
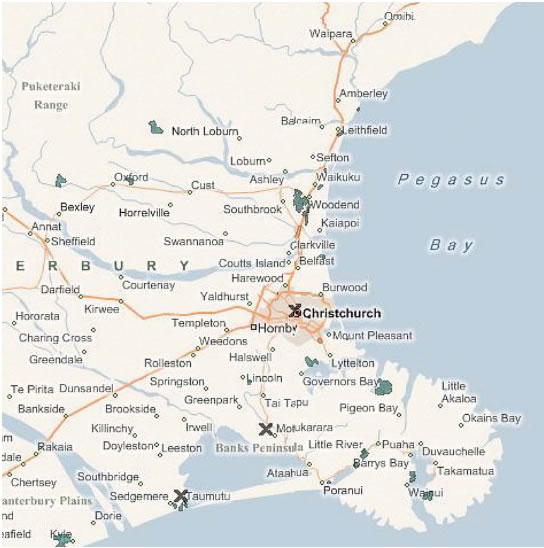
Source: Te Puni Kōkiri, Māori Land Online.
Māori population of Ōtautahi and Waimakariri
3.17
An estimated 35,200 people in Canterbury were Māori in 2011, using projections based on the number of people who identified as Māori in the 2006 Census. The Māori population in tautahi and Waimakariri is expected to grow at a relatively high rate. Figure 21 sets out the projected population increase for each local authority.
Figure 21
Māori population trends in each local authority area of Ōtautahi and Waimakariri (using 2006 Census data)
| Local authority | Māori population (% of the district) | Population growth | Expected Māori population growth |
|---|---|---|---|
| Christchurch City Council | 31,700 (8%) | Before the earthquakes of 2010 and 2011, the Māori population was expected to increase by 7100 people (22% of the current Māori population) by 2021. The total population was expected to grow by 25,600 (6.8%) by 2021. |
High |
| Waimakariri District Council | 3500 (7%) | Before the earthquakes of 2010 and 2011, the Māori population was expected to increase by 800 people (23% of the current Māori population) by 2021. The total Waimakariri district population was expected to increase by 8100 (16.5%) by 2021. |
High |
3.18
Not all of these people will whakapapa to the local area, and they will therefore not all have shares in Māori land (nor will all those who do come from the local area). Figure 22 shows the number of Māori from the region's iwi, as an approximation of how many Māori might be "eligible" for housing on Māori land.
Figure 22
Canterbury iwi and their population resident in Te Waipounamu (using 2006 Census data)
| Iwi | Population resident in region | Population resident elsewhere in New Zealand |
|---|---|---|
| Ngāi Tahu | 13,683 | 49,185 |
| Ngāti Mamoe | 654 | 2877 |
| Waitaha | 246 | 972 |
Māori household incomes in Ōtautahi and Waimakariri
3.19
In the Ōtautahi and Waimakariri region, 48% of Māori households have a yearly income of less than $50,000, and 25% of Māori households have a yearly income of less than $30,000. Figure 23 shows the proportion of Māori households by income bracket.
Figure 23
Incomes of Māori households in Ōtautahi and Waimakariri (using 2006 Census data)
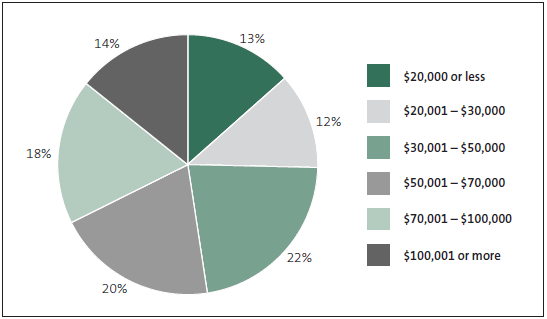
Note: "Not stated" responses have been removed from this pie chart.
Particular challenges and features of Ōtautahi and Waimakariri
3.20
The challenges and features of Ōtautahi and Waimakariri include:
- There is little Māori land in the region, but some is highly suitable for housing.
- The lack of connection to reticulated water and wastewater is a source of ill-feeling. The Māori Reserve at Tuahiwi is one of the few places in the Waimakariri district yet to be connected. Costings for connecting households to reticulated water supply have varied, and have been as high as $25,000 for each house. Waimakariri District Council told us that the most recent estimates for connecting to the reticulated water system are between $6,000 and $7,000 for each property.
- Having a large and well-established iwi rūnanga means there could be a close relationship between Māori and the local authorities. Already, representatives of Ngāi Tahu meet weekly with Christchurch City Council. Waimakariri District Council also has a strong relationship with Te Rūnanga o Ngāi Tuahuriri.

