4. State and trends in freshwater quality
4.1: Environment Southland
A maximum of 56 SoE sites in the Southland region met our criteria for trend analysis varied by water quality variable (Table 9), but only 1 site for SS data. The location of these sites, the variables they include and their water quality state and trend are summarised in the maps shown in Figure 3 to Figure 11. In general these maps show that sites on the eastern Southland plains have tended to exceed guidelines more frequently than the more inland sites regardless of variable being considered. The spatial patterns of trends is less clear with increasing and decreasing trends occurring in both upland and low elevation sites. The state of individual sites showed strong variation across variables (Appended Table 31). Sites can meet guidelines for some variables and not for others. Trend direction and strength at individual sites also showed strong variation across variables. This variability in state and trends within sites according to the variables that are being considered makes it difficult to single out particular sites or catchments as problematic. The sites have been ordered in Appended Table 31 according to a ranking from worst to best water quality. This is a subjective ranking that does not take into account potentially important factors such as the extent to which sites fail guidelines. It is also important to note that the network of sampling sites shown in Figure 3 to Figure 11 is sparse relative to the region's river network. We therefore consider that an overview of the region's water quality is more robustly made by considering the grouping and assessment of state and trends data in the following two sections.
Table 9:
Number of river sites in Southland by variable and REC categories that meet criteria for trend analysis. See Table 3 for an explanation of the REC categories.
| Landcover | Topography | ||||||||||||
|---|---|---|---|---|---|---|---|---|---|---|---|---|---|
| EF | IF | P | S | T | U | W | GM | H | L | Lk | M | Total | |
| CLAR | 1 | 8 | 37 | 0 | 5 | 1 | 2 | 0 | 15 | 34 | 4 | 1 | 54 |
| COND | 1 | 10 | 37 | 0 | 5 | 1 | 2 | 0 | 15 | 34 | 4 | 1 | 56 |
| DRP | 1 | 10 | 36 | 0 | 5 | 1 | 2 | 0 | 16 | 34 | 4 | 1 | 55 |
| ECOLI | 1 | 8 | 34 | 0 | 5 | 1 | 2 | 0 | 14 | 34 | 4 | 1 | 51 |
| FC | 1 | 8 | 33 | 0 | 5 | 1 | 2 | 0 | 14 | 33 | 1 | 2 | 50 |
| NH4-N | 1 | 10 | 37 | 0 | 5 | 1 | 2 | 0 | 16 | 35 | 4 | 1 | 56 |
| NOx-N | 1 | 10 | 37 | 0 | 5 | 1 | 2 | 0 | 16 | 32 | 4 | 1 | 56 |
| SS | 0 | 0 | 1 | 0 | 0 | 0 | 0 | 0 | 0 | 1 | 0 | 0 | 1 |
| TN | 1 | 10 | 37 | 0 | 5 | 1 | 2 | 0 | 16 | 35 | 4 | 1 | 56 |
| TP | 1 | 10 | 36 | 0 | 5 | 1 | 2 | 0 | 16 | 34 | 4 | 1 | 55 |
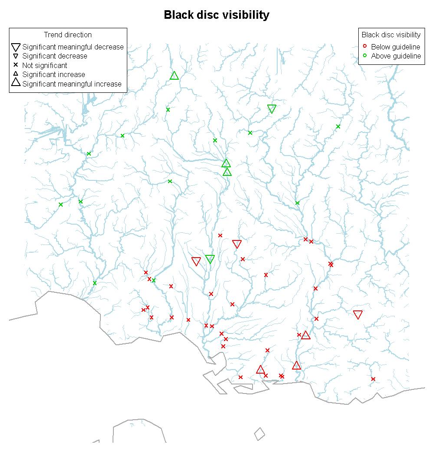
Figure 3:
Location of the Southland region SoE sites for which visual clarity data met our criteria for trend analysis showing the size of the trend and whether the site median values are above or below the guideline values shown in Table 2.
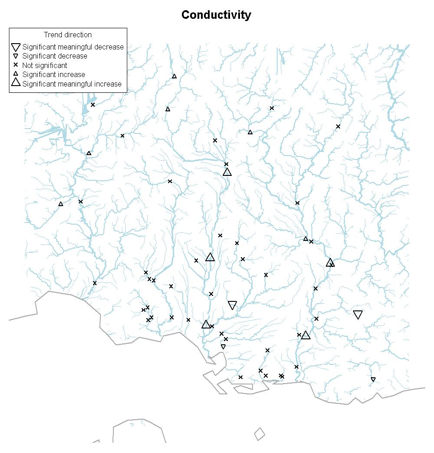
Figure 4:
Location of the Southland region SoE sites for which conductivity data met our criteria for trend analysis showing the size of the trend. Note that conductivity is an indicator of ion content, but that there is no guideline value.
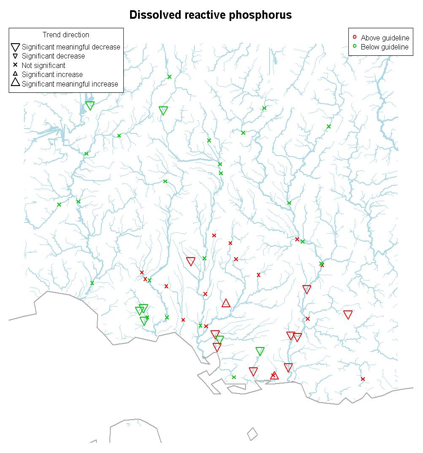
Figure 5:
Location of the Southland region SoE sites for which DRP data met our criteria for trend analysis showing the size of the trend and whether the site median values are above or below the guideline values shown in Table 2.
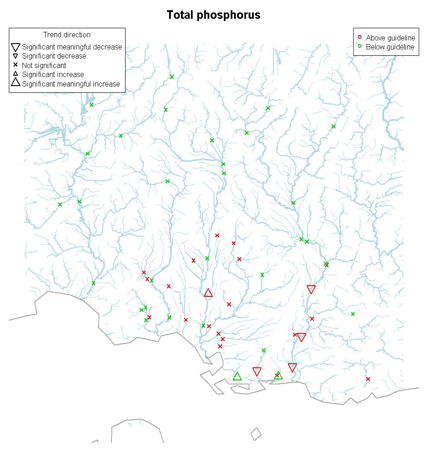
Figure 6:
Location of the Southland region SoE sites for which TP data met our criteria for trend analysis showing the size of the trend and whether the site median values are above or below the guideline values shown in Table 2.
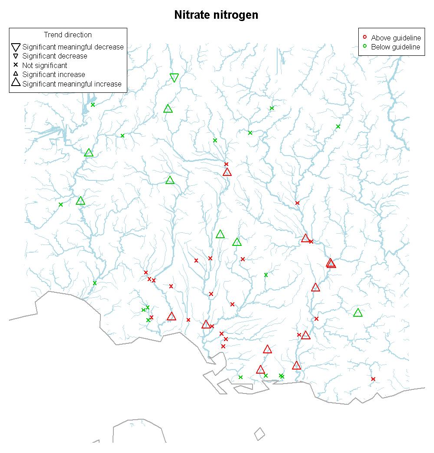
Figure 7:
Location of the Southland region SoE sites for which NOx-N data met our criteria for trend analysis showing the size of the trend and whether the site median values are above or below the guideline values shown in Table 2.
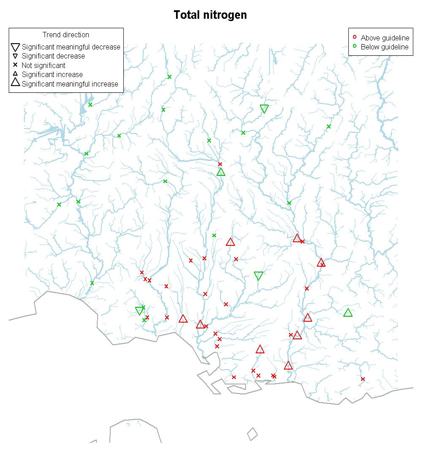
Figure 8:
Location of the Southland region SoE sites for which TN data met our criteria for trend analysis showing the size of the trend and whether the site median values are above or below the guideline values shown in Table 2.
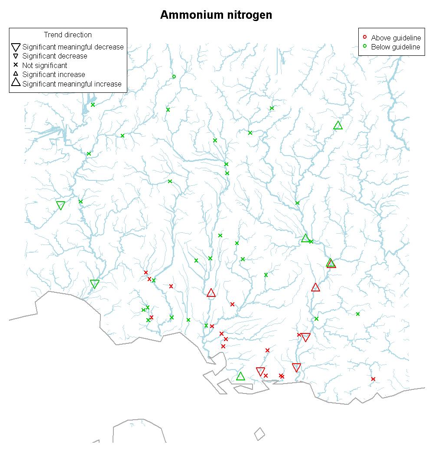
Figure 9:
Location of the Southland region SoE sites for which NH4-N data met our criteria for trend analysis showing the size of the trend and whether the site median values are above or below the guideline values shown in Table 2.
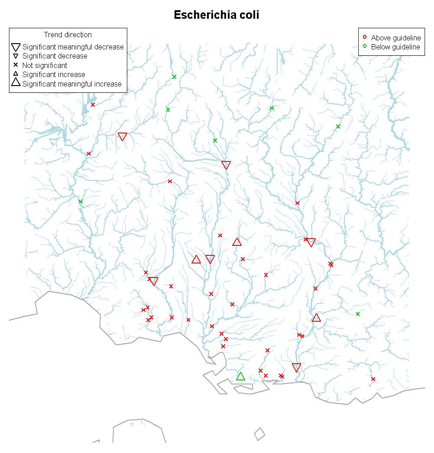
Figure 10:
Location of the Southland region SoE sites for which E.coli data met our criteria for trend analysis showing the size of the trend and whether the site median values are above or below the guideline values shown in Table 2.
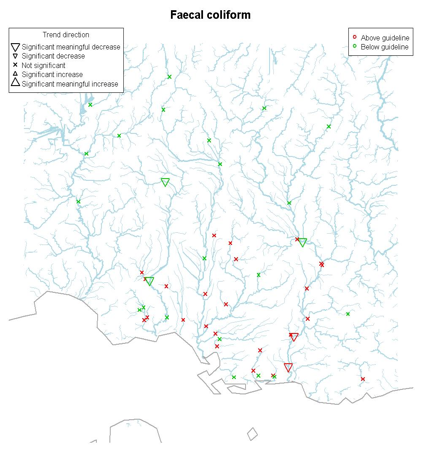
Figure 11:
Location of the Southland region SoE sites for which Faecal Coliform (FC) data met our criteria for trend analysis showing the size of the trend and whether the site median values are above or below the guideline values shown in Table 2.
4.1.1: Water Quality State
Water quality patterns in Southland had strong relationships with REC Topography categories, with the highest water quality (e.g., highest Clarity, lowest conductivity, lowest nutrients and lowest indicator bacteria) in Mountain and Lake Topography categories and poorer water quality in Hill followed by Low Elevation Topography categories (Figure 12). Patterns in water quality were also strongly related to REC Land-cover categories (Figure 13 and Table 10). The Urban Land-cover category had the poorest water quality and sites in this category exceeded water quality guidelines for all variables considered. Sites in the Pasture Land-cover category also had generally poor water quality with more than 50% of sites exceeding guidelines for all variables except E.coli. The majority of sites in the other REC Land-cover categories were within the guideline values.
Table 10:
Kruskall Wallis tests performed by variable for Southland river SoE sites grouped by REC Topography and Land-cover categories. See Table 3 for an explanation of the REC categories. Statistically significant tests are shown with blue text.
| Topography | Land-cover | |||||
|---|---|---|---|---|---|---|
| Variable | Statistic | p-value | n | Statistic | p-value | n |
| CLAR | 30.53 | 0.000 | 54 | 24.97 | 0.000 | 54 |
| COND | 38.59 | 0.000 | 56 | 21.40 | 0.001 | 56 |
| SS | NA | NA | 1 | NA | NA | 1 |
| NH4-N | 27.60 | 0.000 | 56 | 24.37 | 0.000 | 56 |
| NOx-N | 15.70 | 0.001 | 56 | 36.71 | 0.000 | 56 |
| TN | 24.14 | 0.000 | 56 | 35.29 | 0.000 | 56 |
| DRP | 23.88 | 0.000 | 55 | 22.17 | 0.000 | 55 |
| TP | 28.28 | 0.000 | 55 | 23.10 | 0.000 | 55 |
| E.coli | 17.03 | 0.001 | 51 | 30.88 | 0.000 | 51 |
| FC | 16.84 | 0.001 | 50 | 30.87 | 0.000 | 50 |
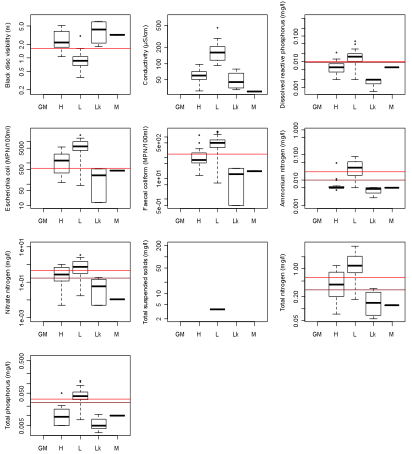
Figure 12:
Median values for Southland sites of the ten water quality variables grouped by REC Topography categories. See Table 3 for an explanation of the REC categories. The guideline values the water quality variables shown in Table 2 are shown as horizontal lines. Where there are two horizontal lines these refer to the upland and lowland site guidelines. Note that low values of Clarity indicate poor water quality, whereas for other variables high values indicate poor water quality.
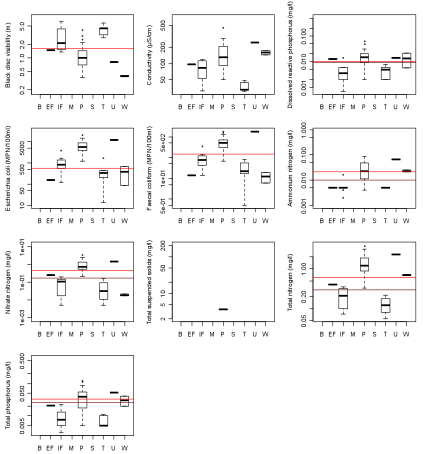
Figure 13:
Median values for Southland sites of the ten water quality variables grouped by REC Land-cover categories. See Table 3 for an explanation of the REC categories. The guideline values the water quality variables shown in Table 2 are shown as horizontal lines. Where there are two horizontal lines these refer to the upland and lowland site guidelines. Note that low values of Clarity indicate poor water quality, whereas for other variables high values indicate poor water quality.
4.1.2: Water Quality Trends
Trends in water quality for the Southland Region are presented in Table 11 and Table 12. There was generally a mixture of both increasing and decreasing trends for all variables. There were increasing overall regional trends (i.e. based on all sites in the region) for COND, NH4-N, NOx-N and TN and decreasing overall regional trends for FC and DRP (Table 12). The overall regional trends were not significant for the other variables.
Table 11:
Number of sites with significant and meaningful trends for all sites in the Southland Region by water quality variable.
| Variable | Total number of sites | Meaningful decreases | Significant decreases | Not significant | Significant increases | Meaningful increases |
|---|---|---|---|---|---|---|
| Clarity | 54 | 5 | 0 | 43 | 0 | 6 |
| Conductivity | 56 | 2 | 2 | 41 | 6 | 5 |
| DRP | 55 | 16 | 0 | 37 | 0 | 2 |
| ECOLI | 51 | 3 | 0 | 48 | 0 | 0 |
| FC | 50 | 5 | 0 | 45 | 0 | 0 |
| NH4-N | 56 | 5 | 0 | 44 | 0 | 7 |
| NOx-N | 56 | 1 | 0 | 37 | 0 | 18 |
| SS | 1 | 0 | 0 | 1 | 0 | 0 |
| TN | 56 | 3 | 0 | 42 | 0 | 11 |
| TP | 55 | 4 | 4 | 48 | 0 | 3 |
Table 12:
Overall trends for the Southland region by water quality variable determined by grouping trends for all sites and using a binomial test (Significance level = 0.05).
| Variable | Total number of sites | p | Overall trend direction |
|---|---|---|---|
| Clarity | 54 | 1 | Not Significant |
| Conductivity | 56 | 0.005 | Increasing |
| DRP | 55 | 0 | Decreasing |
| ECOLI | 51 | 0.092 | Not Significant |
| FC | 50 | 0.003 | Decreasing |
| NH4-N | 56 | 0.022 | Increasing |
| NOx-N | 56 | 0 | Increasing |
| SS | NA | NA | NA |
| TN | 56 | 0.001 | Increasing |
| TP | 55 | 0.788 | Not Significant |
There were eight overall trends in the Topography category groupings (Table 13). There was a significant overall decreasing trend (improving water quality) in DRP, ECOLI and FC for sites in the Hill Topography category (Binomial test; Table 13). There was a significant overall increasing trend for COND and NOx-N (deteriorating water quality) for the Hill sites (Binomial test; Table 13). In sites in the Low-elevation Topography category there were overall increasing trends in NH4-N NOx-N and TN.
Table 13:
REC Topography categories for which there were significant overall trends in the Southland Region by water quality variable. See Table 3 for an explanation of the REC categories.
| Variable | REC Topography category | Total number of Sites | p-value (binomial test of overall trend) | Overall trend |
|---|---|---|---|---|
| COND | H | 16 | 0.001 | Increasing |
| DRP | H | 16 | 0 | Decreasing |
| ECOLI | H | 14 | 0.013 | Decreasing |
| FC | H | 14 | 0.013 | Decreasing |
| NOx-N | H | 16 | 0.004 | Increasing |
| NH4-N | L | 35 | 0.041 | Increasing |
| NOx-N | L | 35 | 0 | Increasing |
| TN | L | 35 | 0.001 | Increasing |
There were five overall trends in the Pasture Land-cover category groupings (Table 14). No other Land-cover category groupings had significant overall trends. There was a significant overall decreasing trend (improving water quality) in DRP and FC for sites (Binomial test; Table 14). There were significant overall increasing trends (deteriorating water quality) for COND, NOx-N and TN (Binomial test; Table 14).
Table 14:
REC Land-cover categories for which there were significant overall trends in the Southland Region by water quality variable. See Table 3 for an explanation of the REC categories.
| Variable | REC Land-cover category | Total number of Sites | p-value (binomial test of overall trend) | Overall trend |
|---|---|---|---|---|
| COND | Pasture | 37 | 0.008 | Increasing |
| DRP | Pasture | 36 | 0.011 | Decreasing |
| FC | Pasture | 33 | 0.005 | Decreasing |
| NOx-N | Pasture | 37 | 0 | Increasing |
| TN | Pasture | 37 | 0 | Increasing |
4.2: Taranaki Regional Council
A maximum of 12 SoE sites in the Taranaki region met our criteria for trend analysis by water quality variable (Table 15). The location of these sites, the variables they include and their water quality state and trend are summarised on Figure 14 to Figure 24. In general the maps show that the more coastal or lower sites on the Taranaki Ring Plains have tended to exceed guidelines more frequently than those higher on the slopes of Mount Taranaki and the other headwater locations regardless of variable being considered. The spatial patterns of trends is less clear with increasing and decreasing trends occurring in both upland and low elevation sites. The state of individual sites showed strong variation across variables (Appended Table 32). Sites can meet guidelines for some variables and not for others. Trend direction and strength at individual sites also showed strong variation across variables. This variability in state and trends within sites according to the variables that are being considered makes it difficult to single out particular sites or catchments as problematic. The sites have been ordered in Appended Table 32 according to a ranking from worst to best water quality. This is a subjective ranking that does not take into account potentially important factors such as the extent to which sites fail guidelines. IWe note that the network of sampling sites shown in Figure 14 to Figure 24 is sparse relative to the region's river monitoring network.
Table 15:
Number of river sites in Taranaki by variable and REC categories that meet criteria for trend analysis. See Table 3 for an explanation of the REC categories.
| Landcover | Topography | ||||||||||||
|---|---|---|---|---|---|---|---|---|---|---|---|---|---|
| Variable | EF | IF | P | S | T | U | W | GM | H | L | Lk | M | Total |
| CLAR | 0 | 3 | 8 | 1 | 0 | 0 | 0 | 0 | 5 | 7 | 0 | 0 | 12 |
| COND | 0 | 3 | 8 | 1 | 0 | 0 | 0 | 0 | 5 | 7 | 0 | 0 | 12 |
| DRP | 0 | 3 | 8 | 1 | 0 | 0 | 0 | 0 | 5 | 7 | 0 | 0 | 12 |
| ECOLI | 0 | 2 | 6 | 1 | 0 | 0 | 0 | 0 | 4 | 5 | 0 | 0 | 9 |
| FC | 0 | 2 | 6 | 1 | 0 | 0 | 0 | 0 | 4 | 5 | 0 | 0 | 9 |
| NH4-N | 0 | 3 | 8 | 1 | 0 | 0 | 0 | 0 | 5 | 7 | 0 | 0 | 12 |
| NOx-N | 0 | 3 | 8 | 1 | 0 | 0 | 0 | 0 | 5 | 7 | 0 | 0 | 12 |
| SS | 0 | 0 | 0 | 0 | 0 | 0 | 0 | 0 | 0 | 0 | 0 | 0 | 0 |
| TN | 0 | 3 | 8 | 1 | 0 | 0 | 0 | 0 | 5 | 7 | 0 | 0 | 12 |
| TP | 0 | 3 | 8 | 1 | 0 | 0 | 0 | 0 | 5 | 7 | 0 | 0 | 12 |
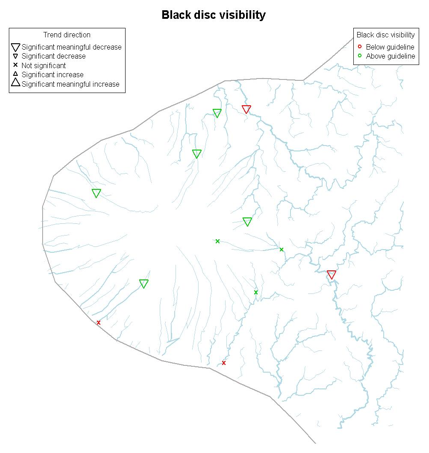
Figure 14:
Location of the Taranaki region SoE sites for which Clarity data met our criteria for trend analysis showing the size of the trend and whether the site median values are above or below the guideline values shown in Table 2.
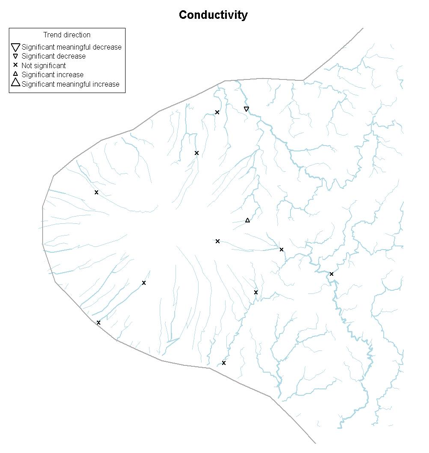
Figure 15:
Location of the Taranaki region SoE sites for which conductivity data met our criteria for trend analysis showing the size of the trend. Note that conductivity is an indicator of ion concentration but that there is no guideline value.
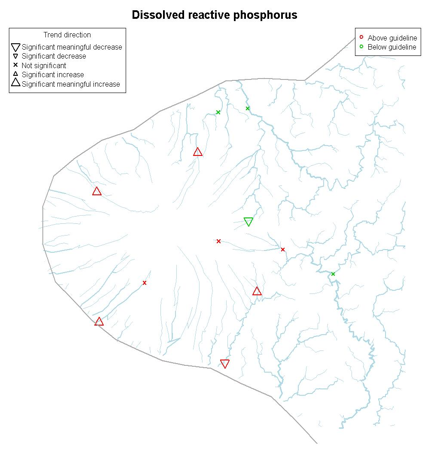
Figure 16:
Location of the Taranaki region SoE sites for which DRP data met our criteria for trend analysis showing the size of the trend and whether the site median values are above or below the guideline values shown in Table 2.
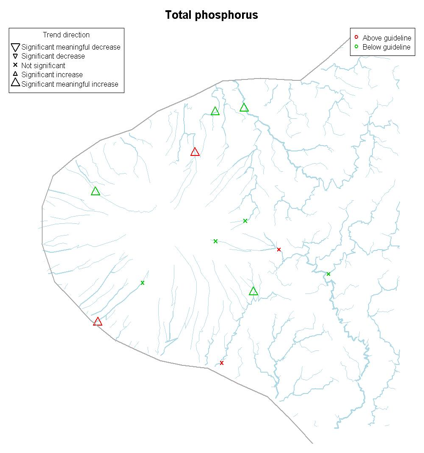
Figure 17:
Location of the Taranaki region SoE sites for which TP data met our criteria for trend analysis showing the size of the trend and whether the site median values are above or below the guideline values shown in Table 2.
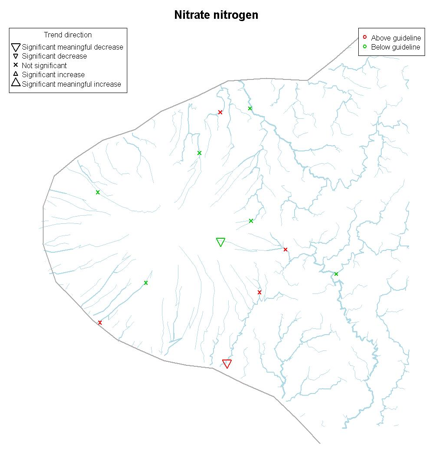
Figure 18:
Location of the Taranaki region SoE sites for which NOx-N data met our criteria for trend analysis showing the size of the trend and whether the site median values are above or below the guideline values shown in Table 2.
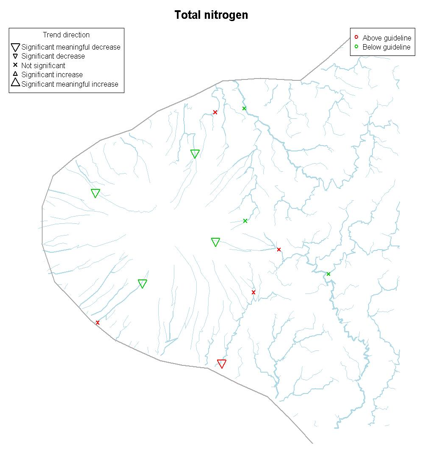
Figure 19:
Location of the Taranaki region SoE sites for which TN data met our criteria for trend analysis showing the size of the trend and whether the site median values are above or below the guideline values shown in Table 2.
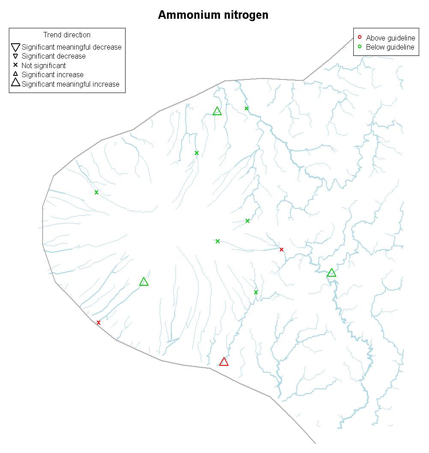
Figure 20:
Location of the Taranaki region SoE sites for which NH4-N data met our criteria for trend analysis showing the size of the trend and whether the site median values are above or below the guideline values shown in Table 2.
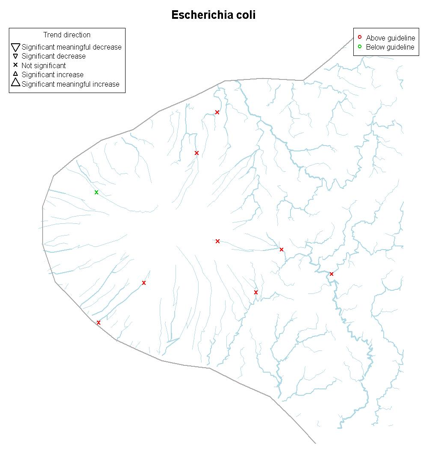
Figure 21:
Location of the Taranaki region SoE sites for which E.coli data met our criteria for trend analysis showing the size of the trend and whether the site median values are above or below the guideline values shown in Table 2.
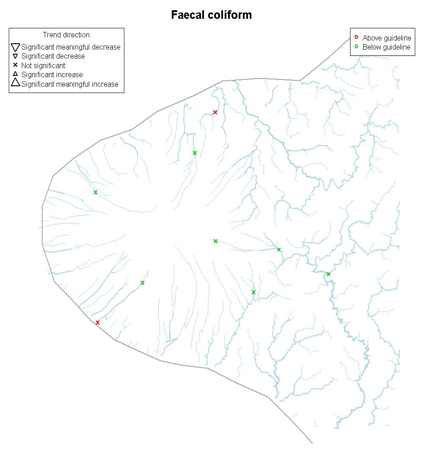
Figure 22:
Location of the Taranaki region SoE sites for which Faecal Coliform (FC) data met our criteria for trend analysis showing the size of the trend and whether the site median values are above or below the guideline values shown in Table 2.
4.2.1: Water Quality State
As shown on maps (Figure 14 to Figure 21) and Table 16 water quality patterns in the Taranaki region had strong relationships with Topography of the upstream catchments. These topographic differences are illustrated by REC Topography categories with the higher water quality (e.g., highest Clarity, lowest conductivity, lowest nutrients and lowest indicator bacteria) in the Hill Topography category than in the Low-elevation Topography category (Figure 23). Patterns in water quality were also strongly related to REC Land-cover categories (Figure 24 and Table 16). The Pasture Land-cover category had the poorest water quality with the majority of sites in this category exceeding water quality guidelines for all variables. The majority of sites in the other REC Land-cover categories were within the guideline values. The majority of sites in the Taranki region exceed the DRP guidelines probably because the volcanic soils of the region that are naturally high in phosphorus (for example, DRP is fairly high in IF as well as P (Figure 24).
Table 16:
Kruskall Wallis tests performed by variable for Taranaki river SoE sites grouped by REC Topography and Land-cover categories. See Table 3 for an explanation of the REC categories. Statistically significant tests are shown with blue text.
| Topography | Land-cover | |||||
|---|---|---|---|---|---|---|
| Variable | Statistic | p-value | n | Statistic | p | n |
| CLAR | 6.34 | 0.012 | 12 | 4.88 | 0.087 | 12 |
| COND | 4.81 | 0.028 | 12 | 7.62 | 0.022 | 12 |
| NH4-N | 8.13 | 0.004 | 12 | 7.54 | 0.023 | 12 |
| NOx-N | 7.28 | 0.007 | 12 | 7.52 | 0.023 | 12 |
| TN | 8.08 | 0.004 | 12 | 7.62 | 0.022 | 12 |
| DRP | 0.01 | 0.935 | 12 | 0.12 | 0.943 | 12 |
| TP | 1.49 | 0.222 | 12 | 2.36 | 0.307 | 12 |
| E.coli | 4.86 | 0.027 | 9 | 5.60 | 0.061 | 9 |
| FC | 4.90 | 0.027 | 9 | 5.65 | 0.059 | 9 |
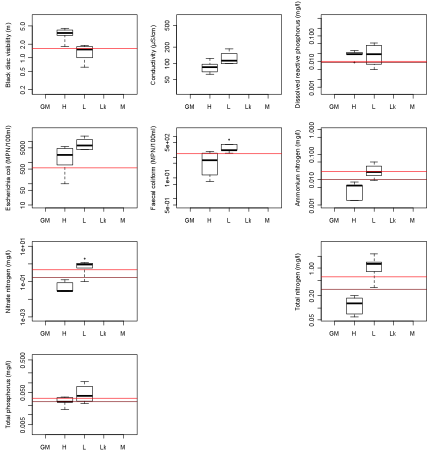
Figure 23:
Median values for Taranaki region sites of the nine water quality variables grouped by REC Topography categories. See Table 3 for an explanation of the REC categories. The guideline values the water quality variables shown in Table 2 are shown as horizontal lines. Where there are two horizontal lines these refer to the upland and lowland site guidelines. Note that low values of Clarity indicate poor water quality, whereas for other variables high values indicate poor water quality.
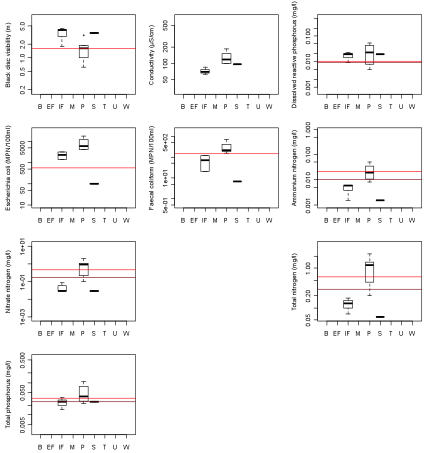
Figure 24:
Median values for Taranaki region sites of nine water quality variables grouped by REC Land-cover categories. See Table 3 for an explanation of the REC categories. The guideline values the water quality variables shown in Table 2 are shown as horizontal lines. Where there are two horizontal lines these refer to the upland and lowland site guidelines. Note that low values of Clarity indicate poor water quality, whereas for other variables high values indicate poor water quality.
4.2.2: Water Quality Trends
Trends in water quality for the Taranaki region are presented in Table 17 and Table 18. There was generally a mixture of both increasing and decreasing trends for all variables considered (Table 17). The majority of overall regional trends (i.e. based on all sites in the region) indicate degrading water quality. There were increasing overall regional trends for NOx-N and TN (deteriorating water quality) and decreasing overall regional trends for Clarity (improving water quality) (Table 17). There was an overall decreasing trend for DRP indicating improving conditions for this variable (Table 17). The overall regional trends were not significant for the other variables.
Table 17:
Number of sites with significant and meaningful trends for all sites in the Taranaki region by water quality variable.
| Variable | Total number of sites | Meaningful decreases | Significant decreases | Not significant | Significant increases | Meaningful increases |
|---|---|---|---|---|---|---|
| CLAR | 12 | 3 | 0 | 9 | 0 | 0 |
| COND | 12 | 0 | 0 | 11 | 1 | 0 |
| DRP | 12 | 1 | 0 | 8 | 0 | 3 |
| ECOLI | 9 | 0 | 0 | 9 | 0 | 0 |
| FC | 9 | 0 | 0 | 9 | 0 | 0 |
| NH4-N | 12 | 0 | 0 | 10 | 0 | 2 |
| NOx-N | 12 | 2 | 0 | 10 | 0 | 0 |
| TN | 12 | 2 | 0 | 10 | 0 | 0 |
| TP | 12 | 0 | 0 | 8 | 0 | 4 |
Table 18:
Overall trends for the Taranaki region by water quality variable determined by grouping trends for all sites and using a binomial test (Significance level = 0.05).
| Variable | Total number of sites | p | Overall trend direction |
|---|---|---|---|
| Clarity | 12 | 0 | Decreasing |
| Conductivity | 12 | 0.388 | Not Significant |
| DRP | 12 | 0.039 | Decreasing |
| ECOLI | 9 | 0.18 | Not Significant |
| FC | 9 | 0.039 | Increasing |
| NH4-N | 12 | 0.006 | Increasing |
| NOx-N | 12 | 0.774 | Not Significant |
| TN | 12 | 0.146 | Not Significant |
| TP | 12 | 0.388 | Not Significant |
There were two overall trends in the Topography category groupings (Table 19). There was a significant overall decreasing trend in clarity for sites in the Low-elevation Topography category (Binomial test; Table 19). There was also a significant overall increasing trend for conductivity and NH4-N for sites in the Low-elevation Topography category (Binomial test; Table 19).
Table 19:
REC Topography categories for which there were significant overall trends in the Taranaki Region by water quality variable. See Table 3 for an explanation of the REC categories.
| Variable | REC Topography category | Total number of Sites | p-value (binomial test of overall trend) | Overall trend |
|---|---|---|---|---|
| CLAR | L | 7 | 0.016 | Decreasing |
| NH4-N | L | 7 | 0.016 | Increasing |
There were four overall trends in the Pasture Land-cover category groupings (Table 20). No other Land-cover category groupings had significant overall trends. All four overall trends in the Pasture Land-cover categories indicated degrading water quality in these rivers over the period of analysis. There was a significant overall decreasing trend in Clarity and significant overall increasing trends for FC, and NH4-N (Binomial test; Table 20).
In general the overall trends (i.e. based on the groupings of sites) indicate degrading water quality. However, there was an improving overall regional trend in DRP. This was not significant however in the REC Topography and Land-cover category groupings.
Table 20:
REC Land-cover categories for which there were significant overall trends in the Taranaki Region by water quality variable. See Table 3 for an explanation of the REC categories.
| Variable | REC Land-cover category | Total number of Sites | p-value (binomial test of overall trend) | Overall trend |
|---|---|---|---|---|
| CLAR | P | 8 | 0.008 | Decreasing |
| ECOLI | P | 6 | 0.031 | Increasing |
| FC | P | 6 | 0.031 | Increasing |
| NH4-N | P | 8 | 0.008 | Increasing |
4.3: Horizons Regional Council
A maximum of 17 SoE sites in the Horizons Regional Council region met our criteria for trend analysis (Table 21). The location of these sites, the variables they include and their water quality state and trend are summarised on Figure 25 to Figure 32. The maps highlight that sites in the catchment of the Manawatu River have tended to exceed guidelines for a range of variables including clarity, DRP, TP, NOx-N, TN and E.coli. The spatial patterns of trends are less clear with increasing and decreasing trends occurring throughout the region. The state of individual sites showed strong variation across variables (Appended Table 29). Sites can meet guidelines for some variables and not for others. Trend direction and strength at individual sites also showed strong variation across variables. This variability in state and trends within sites according to the variables that are being considered makes it difficult to single out particular sites or catchments as problematic. The sites have been ordered in Appended Table 29 according to a ranking from worst to best water quality. This is a subjective ranking that does not take into account potentially important factors such as the extent to which sites fail guidelines. The network of sampling sites shown in Figure 25 to Figure 32 is sparse relative to the region's river network.
Table 21:
Number of sites in Horizons by variable and REC categories that meet criteria for trend analysis. See Table 3 for an explanation of the REC categories.
| Landcover | Topography | ||||||||||||
|---|---|---|---|---|---|---|---|---|---|---|---|---|---|
| Variable | EF | IF | P | S | T | U | W | GM | H | L | Lk | M | Total |
| CLAR | 0 | 1 | 15 | 0 | 0 | 0 | 0 | 0 | 7 | 8 | 0 | 0 | 16 |
| COND | 0 | 1 | 16 | 0 | 0 | 0 | 0 | 0 | 7 | 9 | 0 | 1 | 17 |
| DRP | 0 | 1 | 16 | 0 | 0 | 0 | 0 | 0 | 7 | 9 | 0 | 1 | 17 |
| ECOLI | 0 | 0 | 8 | 0 | 0 | 0 | 0 | 0 | 4 | 4 | 0 | 0 | 8 |
| FC | 0 | 0 | 0 | 0 | 0 | 0 | 0 | 0 | 0 | 0 | 0 | 0 | 0 |
| NH4-N | 0 | 1 | 14 | 0 | 0 | 0 | 0 | 0 | 6 | 8 | 0 | 1 | 15 |
| NOx-N | 0 | 1 | 16 | 0 | 0 | 0 | 0 | 0 | 7 | 9 | 0 | 1 | 17 |
| SS | 0 | 1 | 9 | 0 | 0 | 0 | 0 | 0 | 5 | 5 | 0 | 0 | 10 |
| TN | 0 | 0 | 7 | 0 | 0 | 0 | 0 | 0 | 2 | 4 | 0 | 1 | 7 |
| TP | 0 | 0 | 8 | 0 | 0 | 0 | 0 | 0 | 2 | 5 | 0 | 1 | 8 |
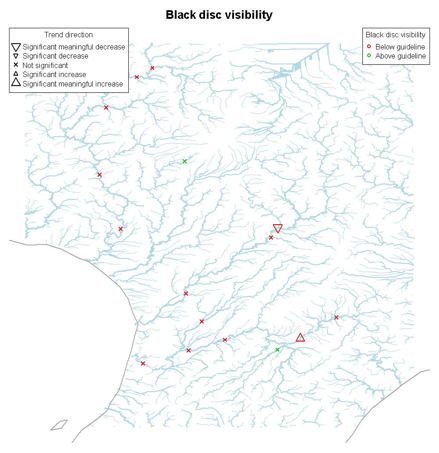
Figure 25:
Location of the Horizons region SoE sites for which Clarity data met our criteria for trend analysis showing the size of the trend and whether the site median values are above or below the guideline values shown in Table 2.
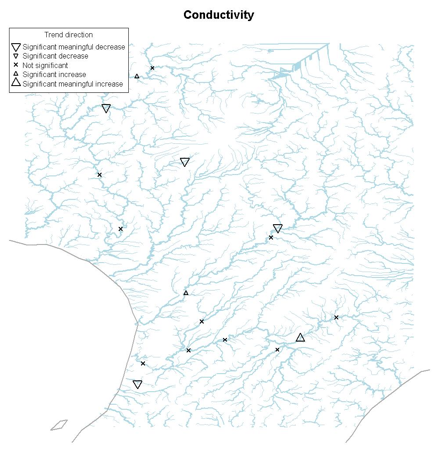
Figure 26:
Location of the Horizons region SoE sites for which conductivity data met our criteria for trend analysis showing the size of the trend. Note that conductivity is an indicator of contamination but that there is no guideline value.
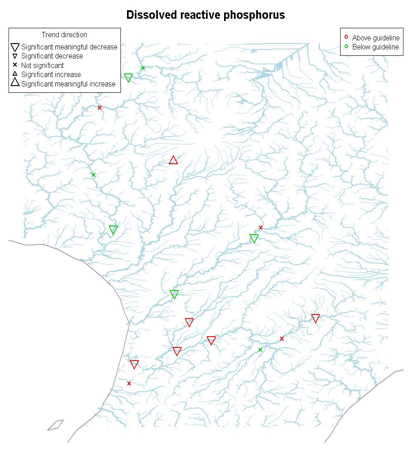
Figure 27:
Location of the Horizons region SoE sites for which DRP data met our criteria for trend analysis showing the size of the trend and whether the site median values are above or below the guideline values shown in Table 2.
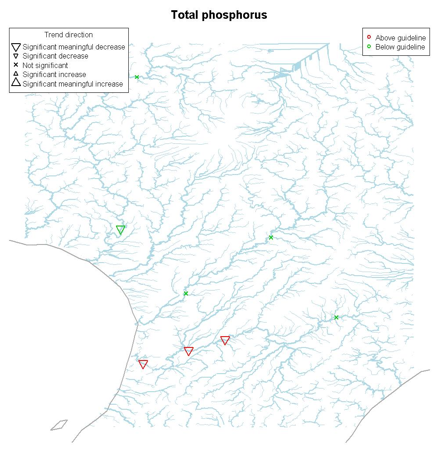
Figure 28:
Location of the Horizons region SoE sites for which TP data met our criteria for trend analysis showing the size of the trend and whether the site median values are above or below the guideline values shown in Table 2.
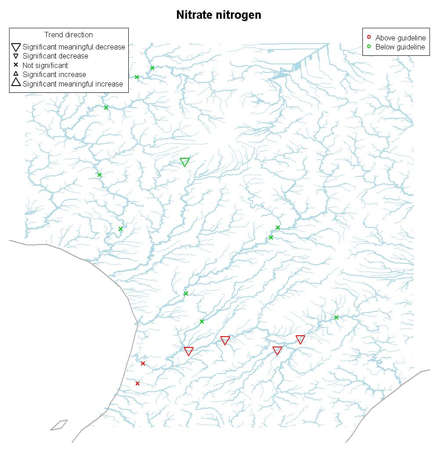
Figure 29:
Location of the Horizons region SoE sites for which NOx-N data met our criteria for trend analysis showing the size of the trend and whether the site median values are above or below the guideline values shown in Table 2.
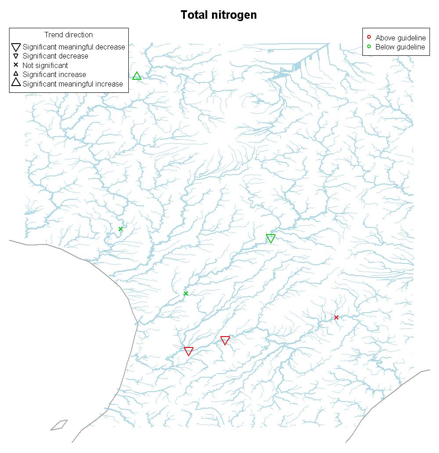
Figure 30:
Location of the Horizons region SoE sites for which TN data met our criteria for trend analysis showing the size of the trend and whether the site median values are above or below the guideline values shown in Table 2.
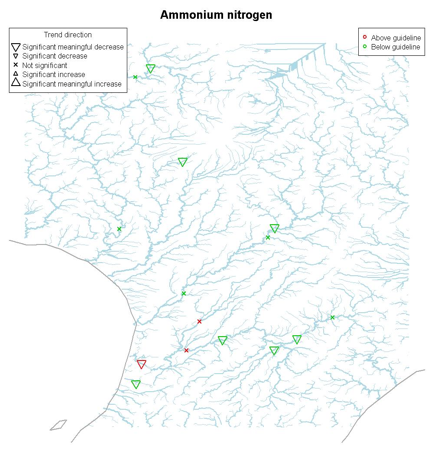
Figure 31:
Location of the Horizons region SoE sites for which NH4-N data met our criteria for trend analysis showing the size of the trend and whether the site median values are above or below the guideline values shown in Table 2.
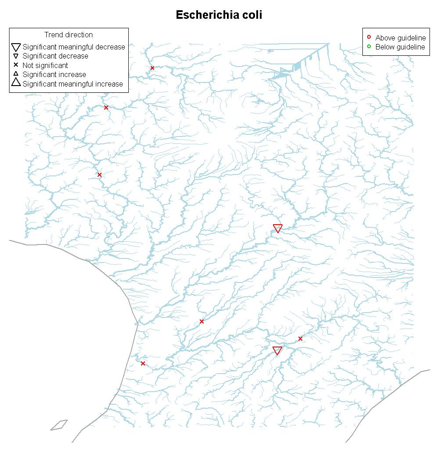
Figure 32:
Location of the Horizons region SoE sites for which E.coli data met our criteria for trend analysis showing the size of the trend and whether the site median values are above or below the guideline values shown in Table 2.
4.3.1: Water Quality State
The low number of sites that met our criteria for analysis meant that we detected few significant patterns in water quality in the Horizons region (Table 22). The highest water quality (e.g., highest Clarity, lowest conductivity, lowest nutrients and lowest indicator bacteria) occurred in the Hill Topography category and poorer water quality occurred in Low Elevation Topography categories (Figure 33). Water clarity in the region was remarkable in that nearly all sites were below the guideline value (i.e., the water clarity is regionally poor and often unsuitable for contact recreation). This may be partly attributable to the soils of the region that are vulnerable to erosion. Patterns in water quality were also strongly related to REC Land-cover categories (Figure 34). The Pasture Land-cover category had poor water quality with the majority of sites in this category exceeding water quality guidelines for all variables considered. Very few of the analysed sites belonged to other REC Land-cover categories (Figure 33), so no significant patterns in water quality state associated with Land-cover categories could be detected (Table 22).
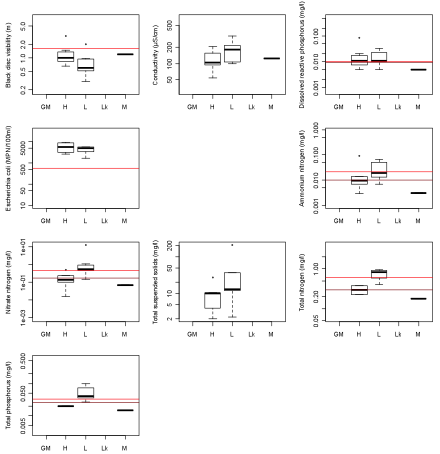
Figure 33:
Median values for Horizons Regional Council sites of the nine water quality variables grouped by REC Topography categories. See Table 3 for an explanation of the REC categories. The guideline values the water quality variables shown in Table 2 are shown as horizontal lines. Where there are two horizontal lines these refer to the upland and lowland site guidelines. Note that low values of Clarity indicate poor water quality, whereas for other variables high values indicate poor water quality.
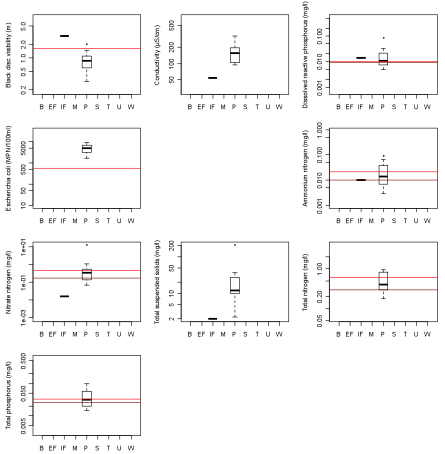
Figure 34:
Median values for Horizons Regional Council sites of nine water quality variables grouped by REC Land-cover categories. See Table 3 for an explanation of the REC categories. The guideline values the water quality variables shown in Table 2 are shown as horizontal lines. Where there are two horizontal lines these refer to the upland and lowland site guidelines. Note that low values of Clarity indicate poor water quality, whereas for other variables high values indicate poor water quality.
Table 22:
Kruskall Wallis tests performed by variable for Horizons river SoE sites grouped by REC Topography and Land-cover categories. See Table 3 for an explanation of the REC categories. Statistically significant tests are shown with blue text.
| Topography | Land-cover | |||||
|---|---|---|---|---|---|---|
| Variable | Statistic | p-value | n | Statistic | p-value | n |
| CLAR | 4.05 | 0.132 | 16 | 2.65 | 0.104 | 16 |
| COND | 3.43 | 0.180 | 17 | 2.67 | 0.102 | 17 |
| SS | 1.84 | 0.175 | 10 | 2.45 | 0.177 | 10 |
| NH4-N | 3.88 | 0.144 | 15 | 0.21 | 0.643 | 15 |
| NOx-N | 8.30 | 0.016 | 17 | 2.67 | 0.102 | 17 |
| TN | 4.82 | 0.090 | 7 | NA | NA | 7 |
| DRP | 2.93 | 0.231 | 17 | 0.17 | 0.683 | 17 |
| TP | 5.25 | 0.072 | 8 | NA | NA | 8 |
| E.coli | 0.33 | 0.564 | 8 | NA | NA | 8 |
4.3.2: Water Quality Trends
Trends in water quality for the Horizons Regional Council region are presented in Table 23 and Table 24. There was generally a mixture of both increasing and decreasing trends for all variables, however the majority of significant trends were meaningful decreases (Table 17). The small number of sites that met our criteria for analysis meant that there were few overall trends that were significant and limited the extent to which we can comment on these. There were decreasing overall regional trends (i.e. based on all sites in the region) for NH4-N and TP (Table 24). There was only one overall trend when sites were grouped by REC categories. This was for NH4-N in the Pasture Land-cover category.
Table 23:
Number of sites with significant and meaningful trends for all sites in the Horizons Regional Council region by water quality variable.
| Variable | Total number of sites | Meaningful decreases | Significant decreases | Not significant | Significant increases | Meaningful increases |
|---|---|---|---|---|---|---|
| CLAR | 16 | 1 | 0 | 14 | 0 | 1 |
| COND | 17 | 4 | 0 | 10 | 2 | 1 |
| DRP | 17 | 9 | 0 | 7 | 0 | 1 |
| ECOLI | 8 | 0 | 0 | 8 | 0 | 0 |
| NH4-N | 15 | 8 | 0 | 7 | 0 | 0 |
| NOx-N | 17 | 5 | 0 | 12 | 0 | 0 |
| SS | 10 | 1 | 0 | 7 | 0 | 2 |
| TN | 7 | 3 | 0 | 3 | 0 | 1 |
| TP | 8 | 4 | 0 | 4 | 0 | 0 |
Table 24:
Overall trends for the Horizons Regional Council region by water quality variable determined by grouping trends for all sites and using a binomial test (Significance level = 0.05).
| Variable | Total number of sites | p | Overall trend direction |
|---|---|---|---|
| NH4-N | 15 | 0.007 | Decreasing |
| TP | 8 | 0.008 | Decreasing |
4.4: Environment Waikato
A maximum of 115 SoE sites in the Waikato region met our criteria for trend analysis by water quality (Table 25). The location of these sites, the variables they include and their water quality state and trend are summarised on Figure 35 to Figure 44. The maps highlight that sites in the headwaters of the Waipa River, the lake Taupo catchments and the Coromandel Peninsular have good water quality (mostly within guidelines for a range of variables). Sites located in the lower elevation plains of the central and coastal Waikato including the valleys of the Waikato, Waipa, Waihou and Piako rivers had poorer water quality (Figure 35 to Figure 44). The spatial patterns of trends are less clear with increasing and decreasing trends occurring throughout the region. A strong downward trend in visual water clarity is evident at a majority of sites and strong upwards trends in nitrate and TN. The state of individual sites showed strong variation across variables (Appended Table 34). Sites can meet guidelines for some variables and not for others. Trend direction and strength at individual sites also showed strong variation across variables. This variability in state and trends within sites according to the variables that are being considered makes it difficult to single out particular sites or catchments as problematic. The sites have been ordered in Appended Table 34 according to a ranking from worst to best water quality. This is a subjective ranking that does not take into account potentially important factors such as the extent to which sites fail guidelines. It is also important to note that the network of sampling sites shown in Figure 35 to Figure 44 is sparse relative to the region's river network. We therefore consider that an overview of the region's water quality is more robustly made by considering the grouping and assessment of state and trends data in the following two sections.
Table 25:
Number of sites in the Waikato region by variable and REC categories that meet criteria for trend analysis. See Table 3 for an explanation of the REC categories.
| Landcover | Topography | ||||||||||||
|---|---|---|---|---|---|---|---|---|---|---|---|---|---|
| Variable | EF | IF | P | S | T | U | W | GM | H | L | Lk | M | Total |
| CLAR | 6 | 16 | 80 | 0 | 0 | 3 | 0 | 0 | 22 | 70 | 12 | 1 | 105 |
| COND | 6 | 17 | 88 | 1 | 0 | 3 | 0 | 0 | 29 | 71 | 14 | 1 | 115 |
| DRP | 6 | 17 | 88 | 1 | 0 | 3 | 0 | 0 | 29 | 71 | 14 | 1 | 115 |
| ECOLI | 6 | 13 | 59 | 0 | 0 | 3 | 0 | 0 | 20 | 52 | 9 | 0 | 81 |
| FC | 6 | 13 | 59 | 0 | 0 | 3 | 0 | 0 | 20 | 52 | 9 | 0 | 81 |
| NH4-N | 6 | 17 | 88 | 1 | 0 | 3 | 0 | 0 | 29 | 71 | 14 | 1 | 115 |
| NOx-N | 6 | 17 | 88 | 1 | 0 | 3 | 0 | 0 | 29 | 71 | 14 | 1 | 115 |
| SS | 0 | 0 | 0 | 0 | 0 | 0 | 0 | 0 | 0 | 0 | 0 | 0 | 0 |
| TN | 6 | 17 | 88 | 1 | 0 | 3 | 0 | 0 | 29 | 71 | 14 | 1 | 115 |
| TP | 6 | 17 | 88 | 1 | 0 | 3 | 0 | 0 | 29 | 71 | 14 | 1 | 115 |
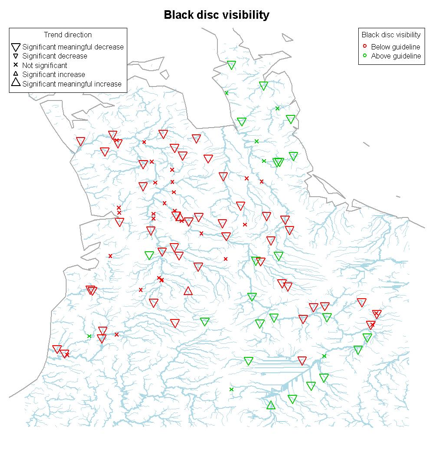
Figure 35:
Location of the Waikato region SoE sites for which Clarity data met our criteria for trend analysis showing the size of the trend and whether the site median values are above or below the guideline values shown in Table 2.
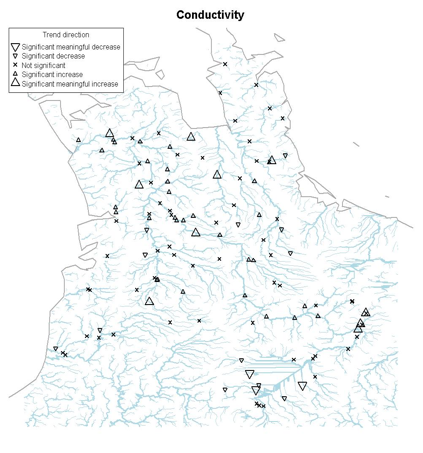
Figure 36:
Location of the Waikato region SoE sites for which Conductivity data met our criteria for trend analysis showing the size of the trend. Note that conductivity is an indicator of ion concentration and contamination but that there is no guideline value.
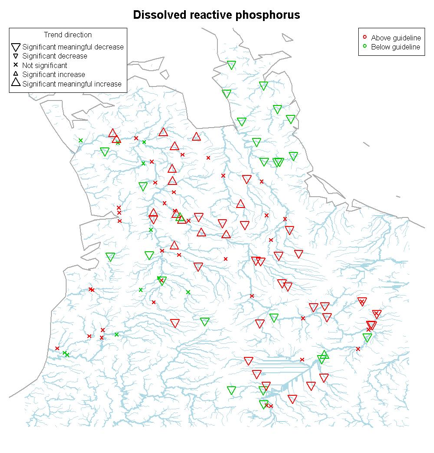
Figure 37:
Location of the Waikato region SoE sites for which DRP data met our criteria for trend analysis showing the size of the trend and whether the site median values are above or below the guideline values shown in Table 2.
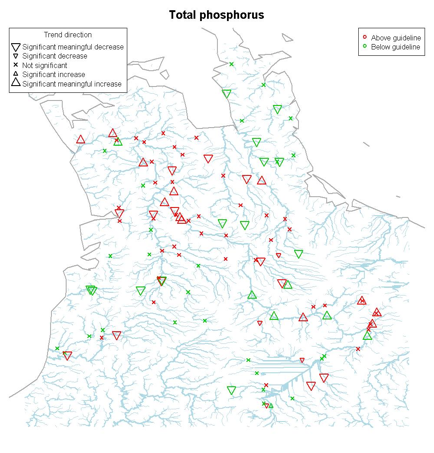
Figure 38:
Location of the Waikato region SoE sites for which DRP data met our criteria for trend analysis showing the size of the trend and whether the site median values are above or below the guideline values shown in Table 2.
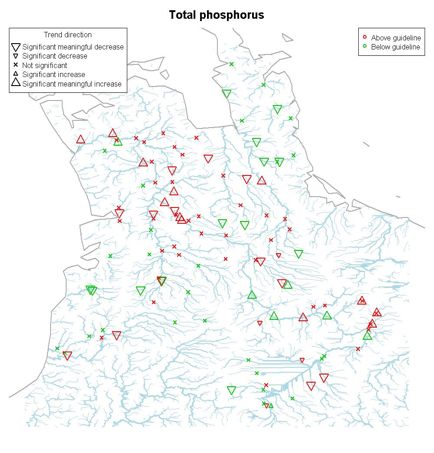
Figure 39:
Location of the Waikato region SoE sites for which TP data met our criteria for trend analysis showing the size of the trend and whether the site median values are above or below the guideline values shown in Table 2.
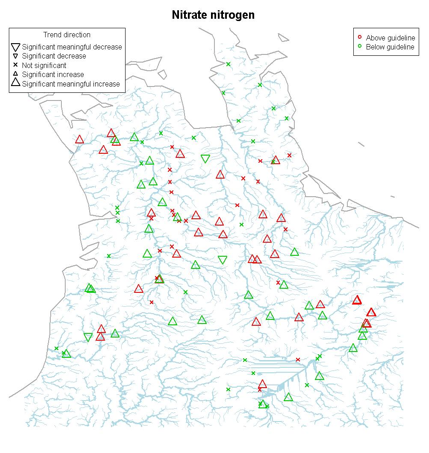
Figure 40:
Location of the Waikato region SoE sites for which NOx-N data met our criteria for trend analysis showing the size of the trend and whether the site median values are above or below the guideline values shown in Table 2.

Figure 40:
Location of the Waikato region SoE sites for which NOx-N data met our criteria for trend analysis showing the size of the trend and whether the site median values are above or below the guideline values shown in Table 2.
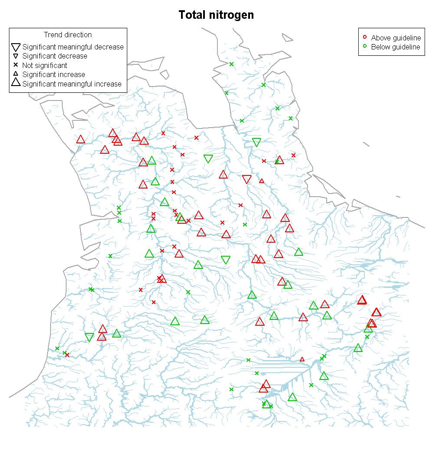
Figure 41:
Location of the Waikato region SoE sites for which TN data met our criteria for trend analysis showing the size of the trend and whether the site median values are above or below the guideline values shown in Table 2.
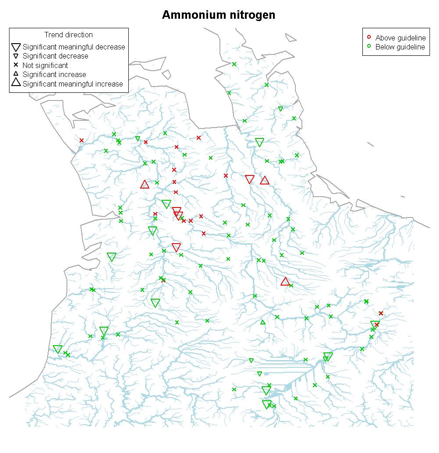
Figure 42:
Location of the Waikato region SoE sites for which DRP data met our criteria for trend analysis showing the size of the trend and whether the site median values are above or below the guideline values shown in Table 2.
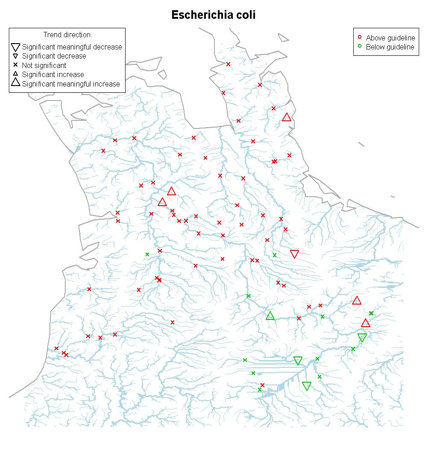
Figure 43:
Location of the Waikato region SoE sites for which E.coli data met our criteria for trend analysis showing the size of the trend and whether the site median values are above or below the guideline values shown in Table 2.
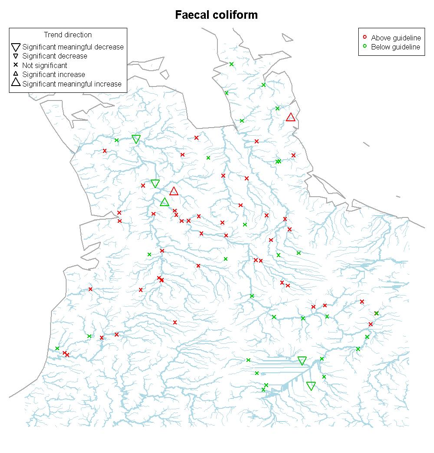
Figure 44:
Location of the Waikato region SoE sites for which Faecal Coliform (FC) data met our criteria for trend analysis showing the size of the trend and whether the site median values are above or below the guideline values shown in Table 2.
4.4.1: Water Quality State
Water quality patterns in the Waikato region had strong relationships with REC Topography categories with the highest water quality (e.g., highest Clarity, lowest conductivity, lowest nutrients and lowest indicator bacteria) generally occurring in the Lake and Hill Topography categories and poorer water quality in Low-elevation Topography categories (Figure 45 and Table 26). The majority of sites in the Lake, Hill and Low-elevation Topography categories were below the water clarity guideline value (i.e. had poor water clarity). The majority of sites in the Lake, Hill and Low-elevation Topography categories were above the guidelines for the other water quality variables. This is mainly attributable to the dominance of Pastoral land use in the region Table 8. Patterns in water quality were strongly related to REC Land-cover categories Figure 46 and Table 26). Urban sites had very poor water quality (Figure 46), followed by the Pasture Land-cover category. The majority of pasture sites exceeded water quality guidelines for all variables considered. Sites in the other REC Land-cover categories had generally better water quality (Figure 46).
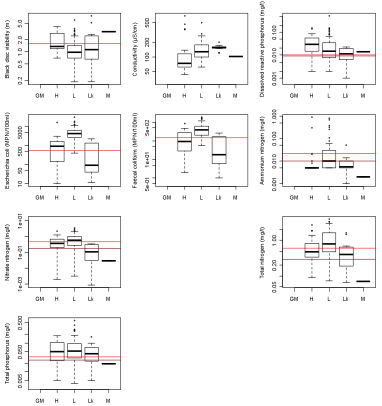
Figure 45:
Median values for Environment Waikato SoE sites of the nine water quality variables grouped by REC Topography categories. See Table 3 for an explanation of the REC categories.The guideline values for the water quality variables shown in Table 2 are shown as horizontal lines. Where there are two horizontal lines these refer to the upland and lowland site guidelines. Note that low values of Clarity indicate poor water quality, whereas for other variables high values indicate poor water quality.
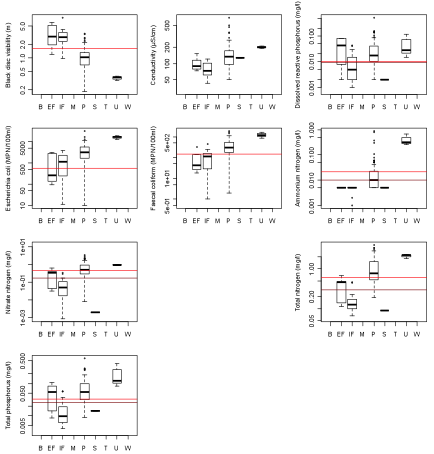
Figure 46:
Median values for Environment Waikato SoE sites of nine water quality variables grouped by REC Land-cover categories. See Table 3 for an explanation of the REC categories. The guideline values for the water quality variables shown in Table 2 are shown as horizontal lines. Where there are two horizontal lines these refer to the upland and lowland site guidelines. Note that low values of Clarity indicate poor water quality, whereas for other variables high values indicate poor water quality.
Table 26:
Kruskall Wallis tests performed by variable for Waikato river SoE sites grouped by REC Topography and Land-cover categories. Statistically significant tests are shown with blue text.
| Topography | Land-cover | |||||
|---|---|---|---|---|---|---|
| Variable | Statistic | p-value | n | Statistic | p | n |
| CLAR | 13.16 | 0.004 | 105 | 40.95 | 0.000 | 105 |
| COND | 22.75 | 0.000 | 115 | 26.07 | 0.000 | 115 |
| NH4-N | 18.69 | 0.000 | 115 | 35.35 | 0.000 | 115 |
| NOx-N | 21.23 | 0.000 | 115 | 40.38 | 0.000 | 115 |
| TN | 14.99 | 0.002 | 115 | 49.21 | 0.000 | 115 |
| DRP | 8.15 | 0.043 | 115 | 15.03 | 0.005 | 115 |
| TP | 2.06 | 0.560 | 115 | 31.93 | 0.000 | 115 |
| E.coli | 31.68 | 0.000 | 81 | 21.02 | 0.000 | 81 |
| FC | 27.80 | 0.000 | 81 | 22.27 | 0.000 | 81 |
4.4.2: Water Quality Trends
Trends in water quality for the Waikato region are presented in Table 27 and Table 28. There was generally a mixture of both increasing and decreasing trends for all variables. There were overall regional trends (i.e. based on all sites in the region) for all variables except FC (Table 28). There were increasing overall regional trends for conductivity, E.coli, NOx-N and TN indicating water quality degradation for these variables. There was a consistent decreasing overall regional trend for clarity, again indicating water quality degradation. There were decreasing overall regional trends for DRP, NH4-N and TP (Table 28), which indicate water quality improvement.
Table 27:
Number of sites with significant and meaningful trends for all sites in the Waikato region by water quality variable.
| Variable | Total number of sites | Meaningful decreases | Significant decreases | Not significant | Significant increases | Meaningful increases |
|---|---|---|---|---|---|---|
| CLAR | 105 | 67 | 0 | 35 | 0 | 3 |
| COND | 115 | 3 | 12 | 60 | 30 | 10 |
| DRP | 115 | 51 | 0 | 48 | 0 | 16 |
| ECOLI | 81 | 2 | 0 | 77 | 0 | 2 |
| FC | 81 | 4 | 0 | 74 | 0 | 3 |
| NH4-N | 115 | 15 | 5 | 91 | 1 | 3 |
| NOx-N | 115 | 3 | 0 | 50 | 0 | 62 |
| TN | 115 | 5 | 0 | 49 | 2 | 59 |
| TP | 115 | 26 | 1 | 66 | 1 | 18 |
Table 28:
Overall trends for the Waikato region by water quality variable determined by grouping trends for all sites and using a binomial test (Significance level = 0.05).
| Variable | Total number of sites | p | Overall trend direction |
|---|---|---|---|
| CLAR | 105 | 0 | Decreasing |
| COND | 115 | 0.005 | Increasing |
| DRP | 115 | 0 | Decreasing |
| ECOLI | 81 | 0.045 | Increasing |
| NH4-N | 115 | 0 | Decreasing |
| NOx-N | 115 | 0 | Increasing |
| TN | 115 | 0 | Increasing |
| TP | 115 | 0 | Decreasing |
There were many overall trends in the REC Topography category groupings (Table 29). In general these trends indicate decreasing water quality in Hill and Low-elevation categories. For example, there were decreasing trends in Clarity and increasing trends in NOx-N, TN, COND, E.coli and FC. However, there were also decreasing trends (i.e. improving water quality trends) in TP and DRP (Binomial test; Table 29).
Table 29:
REC Topography categories for which there were significant overall trends in the Waikato Region by water quality variable. See Table 3 for an explanation of the REC categories.
| Variable | REC Topography category | Total number of Sites | p-value (binomial test of overall trend) | Overall trend |
|---|---|---|---|---|
| CLAR | Hill | 22 | 0 | Decreasing |
| DRP | Hill | 29 | 0 | Decreasing |
| NOx-N | Hill | 29 | 0.001 | Increasing |
| TN | Hill | 29 | 0 | Increasing |
| TP | Hill | 29 | 0.024 | Decreasing |
| CLAR | Low-elevation | 70 | 0 | Decreasing |
| COND | Low-elevation | 71 | 0 | Increasing |
| DRP | Low-elevation | 71 | 0.009 | Decreasing |
| ECOLI | Low-elevation | 52 | 0.003 | Increasing |
| FC | Low-elevation | 52 | 0.036 | Increasing |
| NH4-N | Low-elevation | 71 | 0 | Decreasing |
| NOx-N | Low-elevation | 71 | 0 | Increasing |
| TN | Low-elevation | 71 | 0 | Increasing |
| TP | Low-elevation | 71 | 0 | Decreasing |
| CLAR | Lake | 12 | 0.039 | Decreasing |
| COND | Lake | 14 | 0.002 | Increasing |
| NOx-N | Lake | 14 | 0.002 | Increasing |
| TN | Lake | 14 | 0.002 | Increasing |
There were many overall trends in the REC Land-cover category groupings (Table 30). In general these trends indicate decreasing water quality. For example, there were decreasing trends in Clarity (i.e. decreasing water quality) in Exotic Forest, Indigenous Forest and Pasture categories. There were also increasing trends in COND, ECOLI, NOx-N, and TN (i.e. decreasing water quality). However, there were also decreasing trends (i.e. improving water quality trends) in FC in the Exotic Forest category, COND, DRP, NH4-N and TP in the Indigenous Forest category and DRP, NH4-N and TP in the Pasture category (Binomial test; Table 30).
In general the overall trends (i.e. based on the groupings of sites) indicate degrading water quality. However, there was an improving overall regional trend in DRP and TP.
Table 30:
REC Land-cover categories for which there were significant overall trends in the Waikato Region by water quality variable. See Table 3 for an explanation of the REC categories.
| Variable | REC Land-cover category | Total number of Sites | p-value (binomial test of overall trend) | Overall trend |
|---|---|---|---|---|
| CLAR | EF | 6 | 0.031 | Decreasing |
| FC | EF | 6 | 0.031 | Decreasing |
| CLAR | IF | 16 | 0.004 | Decreasing |
| COND | IF | 17 | 0.049 | Decreasing |
| DRP | IF | 17 | 0.013 | Decreasing |
| NH4-N | IF | 17 | 0.049 | Decreasing |
| TP | IF | 17 | 0 | Decreasing |
| CLAR | P | 80 | 0 | Decreasing |
| COND | P | 88 | 0 | Increasing |
| DRP | P | 88 | 0.002 | Decreasing |
| ECOLI | P | 59 | 0.036 | Increasing |
| NH4-N | P | 88 | 0.001 | Decreasing |
| NOx-N | P | 88 | 0 | Increasing |
| TN | P | 88 | 0 | Increasing |
| TP | P | 88 | 0.042 | Decreasing |
