Part 3: Results of district health board audits
3.1
In this Part, we discuss the challenges the health system is facing, and set out some recent changes in the district health board (DHB) sector including those to accountability arrangements.
3.2
We also outline the financial performance of DHBs in 2009/10 and discuss their financial sustainability.
3.3
Finally, we outline the results of our assessment of the management control environment, financial and non-financial systems and controls of each DHB in 2009/10, and discuss our audit findings on procurement policies and practices, and asset management planning.
Summary of challenges facing the health system
3.4
The public health and disability system faces serious challenges. Costs are rising because improved technologies are available and an ageing population brings increased demand for services. There are international shortages of skilled clinical specialists.
3.5
To ensure that there is a clear focus on these challenges, the Government established the National Health Board within the Ministry of Health (the Ministry) in October 2009. The National Health Board supervises the $10 billion or so of public funding spent on public hospital and primary health care by DHBs.5 It also manages the national planning and funding of all IT, workforce planning, and capital investment in the DHB sector.
3.6
The appropriations for Vote Health continue to increase. However, the rate of increase is slowing, and there is less in the Budget for new initiatives. Vote Health 2009/10 had appropriations totalling over $12.9 billion, including almost $752 million for new policy initiatives. This was an increase of 7.4% from the 2008/09 Supplementary Estimates. The Vote has again increased in 2010/11 to over $13.5 billion, including $512 million in new operating and capital initiatives. The increase this time was 6.7% from the 2009/10 Supplementary Estimates.
3.7
About three-quarters of Vote Health is funding for the health services provided by district health boards (DHBs). The overall funding that DHBs are allocated is based on the Government's spending priorities during the budgeting process. The size of the district's population determines the amount that individual DHBs receive, with additional socio-economic and other risk factors taken into account. The funding covers the health and disability services that the DHB provides directly to its population or indirectly through another provider (such as another DHB, a not-for-profit Primary Health Organisation (PHO), or a private for-profit or not-for-profit provider such as a non-government organisation).
3.8
The Government expects there to be increased financial pressure on the health services. It has started reviewing expenditure line by line to identify funding that could be better used in other areas, particularly frontline health services.
Changes in the health sector since the 2008/09 audits
Fewer district health boards
3.9
There are now 20 DHBs, one fewer than in 2008/09. In response to issues with their financial and clinical sustainability, Otago and Southland DHBs merged during 2009/10 to become Southern DHB. Figure 8 shows, for each DHB, its population at 30 June 2009, and 2009/10 funding.
Figure 8
Population and funding of district health boards in 2009/10
| District health board | Population* | Funding** $million |
|---|---|---|
| North Island | ||
| Auckland | 444,100 | 930.1 |
| Bay of Plenty | 207,700 | 523.2 |
| Capital and Coast | 288,100 | 569.2 |
| Counties Manukau | 481,700 | 1,004.8 |
| Hawke's Bay | 153,900 | 378.2 |
| Hutt Valley | 142,700 | 308.6 |
| Lakes | 101,800 | 244.6 |
| MidCentral | 166,000 | 396.9 |
| Northland | 155,800 | 418.0 |
| Tairawhiti | 46,200 | 124.0 |
| Taranaki | 108,300 | 266.2 |
| Waikato | 360,000 | 840.5 |
| Wairarapa | 39,900 | 105.0 |
| Waitemata | 528,500 | 1,047.7 |
| Whanganui | 63,200 | 180.5 |
| South Island | ||
| Canterbury | 502,000 | 1,079.1 |
| Nelson-Marlborough | 136,800 | 324.1 |
| South Canterbury | 55,600 | 143.4 |
| Southern | 300,400 | 681.5*** |
| West Coast | 32,600 | 106.8 |
| Totals | 4,315,300 | 9,672.6 |
* Statistics New Zealand estimate, 30 June 2009.
** 2009/10 budgeted appropriation, Supplementary Estimates of Appropriations 2009/10, pages 645-655.
*** Southern DHB was established on 1 May 2010, by amalgamating the Otago and Southland DHBs. The funding figure used is the sum of the 2009/10 budgeted figures (Supplementary Estimates) for Otago, Southern, and Southland DHBs.
Fewer Primary Health Organisations
3.10
Under the Primary Health Care Strategy, DHBs initially set up about 80 PHOs. However, this number had reduced to 55 by 31 January 2011. The number is decreasing further as DHBs consider rationalisation at the request of the Minister of Health (the Minister).
Changes to the accountability framework
3.11
DHBs are responsible for identifying and providing for the health needs of their district. They have been required to prepare district strategic and annual plans that are consistent with New Zealand's health and disability strategies. In our last report on the health sector, we included an article on the accountability framework in which we recommended that the range of planning and accountability documents in the sector be reviewed.6
3.12
Under a recent amendment to legislation, each DHB is now required to prepare an annual plan. This will remove the requirement for a District Strategic Plan and a District Annual Plan. The amendment empowers the Minister to require regional planning, and DHBs are increasingly expected to prepare regional plans for health services and resourcing. The new annual plan will include the elements of the Statement of Intent (SOI) – a high-level, less detailed statement about how the DHB intends to address the health needs of its district.
More cross-DHB governance
3.13
Each DHB is governed by a board of up to 11 members. Seven of these are elected every three years, and four are appointed by the Minister. The Minister also appoints a Chair from among the 11.
3.14
The last DHB elections were held in October 2010. At that time, the Minister appointed four board chairs with responsibilities in more than one DHB. He also appointed 10 board members to more than one DHB board.
Accountability arrangements in 2009/10
3.15
The monitoring department for DHBs is the Ministry, which both monitors and supports DHBs through its National Health Board business unit.
3.16
The monitoring regime for 2009/10 had three different levels of intervention – standard monitoring, performance watch, and intensive monitoring.
3.17
The Minister can, in addition to intensive monitoring, change how the DHB is governed to help improve its performance. To do this, the Minister appoints one or more Crown monitors to observe the decision-making processes of the board, to help the board understand the policies and wishes of the Government, and to advise the Minister on any matters about the DHB, the board, or its performance. If seriously dissatisfied, the Minister can dismiss the board and appoint a commissioner.
3.18
As at 31 December 2010, those DHBs on intensive monitoring were Capital and Coast, Southern, West Coast, and Whanganui DHBs. At the same time in 2009, there were also four, the only difference being Southland instead of Southern DHB. Those on performance watch as at 31 December 2010 were Hutt Valley, MidCentral, Taranaki, Wairarapa, and Waitemata DHBs. At the same time in 2009, only four were on performance watch. Only Hutt Valley and Waitemata DHBs were on performance watch in December of both years.
3.19
As at 31 December 2010, Capital and Coast and Hutt Valley DHBs had a joint Crown monitor, and Southern DHB had a Crown monitor. A commissioner was in place in Hawke's Bay DHB during 2009/10 until replaced with a board after the October 2010 elections. Whanganui DHB had two Crown monitors for the first half of 2009/10.
Annual audit
3.20
Under section 15 of the Public Audit Act 2001, the Auditor-General audits the financial statements, accounts, and other information that each of the 20 DHBs and their subsidiaries are required to have audited each year. The Auditor-General does not audit the PHOs, because they are not public entities. The purpose of the annual audit is to give assurance that an entity's reports fairly reflect its financial and non-financial performance, and do not mislead the reader.
Financial performance of district health boards
3.21
Figure 9 sets out the financial performance of the 20 DHBs for the year ended 30 June 2010.
Figure 9
Summary of DHBs' 2009/10 financial performance
| District health board | Revenue* $million | Expenditure* $million | Surplus (deficit)* $million | Deficit as % of revenue | Planned Surplus (deficit)** $million | Variance to plan*** $million |
|---|---|---|---|---|---|---|
| Auckland | 1,711.9 | 1,711.7 | 0.3 | 0.0 | 0.3 | |
| Bay of Plenty | 590.1 | 591.5 | (1.4) | 0.2% | (1.9) | 0.4 |
| Canterbury | 1,331.8 | 1,340.6 | (8.8) | 0.7% | (9.0) | 0.2 |
| Capital and Coast | 841.4 | 888.9 | (47.5) | 5.6% | (47.7) | 0.2 |
| Counties Manukau | 1,216.4 | 1,216.2 | 0.2 | (3.0) | 3.1 | |
| Hawke's Bay | 434.1 | 439.6 | (5.5) | 1.3% | (4.9) | (0.5) |
| Hutt Valley | 423.4 | 427.5 | (4.5) | 1.1% | (4.6) | 0.0 |
| Lakes | 291.7 | 288.7 | 3.0 | (1.0) | 4.0 | |
| MidCentral | 509.9 | 519.3 | (9.4) | 1.8% | (3.5) | (5.9) |
| Nelson-Marlborough | 381.5 | 386.9 | (5.4) | 1.4% | (5.9) | 0.5 |
| Northland | 474.9 | 474.3 | 0.6 | 0.0 | 0.6 | |
| South Canterbury | 165.6 | 165.2 | 0.4 | (0.4) | 0.8 | |
| Southern**** | 813.0 | 827.8 | (14.8) | 1.8% | (15.2) | 6.8 |
| Tairawhiti | 146.1 | 146.9 | (0.5) | 0.4% | (0.3) | (0.3) |
| Taranaki | 305.8 | 308.6 | (3.0) | 1.0% | (2.1) | (0.9) |
| Waikato | 1,074.9 | 1,056.1 | 18.8 | 10.0 | 8.8 | |
| Wairarapa | 123.4 | 128.1 | (4.7) | 3.8% | (0.9) | (3.9) |
| Waitemata | 1,262.2 | 1,270.1 | (7.9) | 0.6% | (9.9) | 2.0 |
| West Coast | 127.3 | 135.0 | (7.7) | 6.1% | (7.6) | (0.1) |
| Whanganui | 207.7 | 211.9 | (4.2) | 2.0% | (7.6) | 3.4 |
| Totals | 12,433.2 | 12,535.2 | (102.1) | (115.4) |
* From DHB annual reports. The surplus/deficit figure does not include revaluations. Also, where the surplus (deficit) figure is affected by profits from joint ventures or associates, it will not be the same as revenue less expenditure. There may be some small differences in the totals due to rounding.
** From DHB annual reports.
*** There may be some small differences due to rounding.
**** Includes the two months results for Southern DHB and 10 months for the former Otago and Southland DHBs.
Financial sustainability
3.22
Figure 9 shows that 17 of the 20 DHBs had budgeted for a deficit for 2009/10.
3.23
The DHB sector is facing considerable financial pressures. These pressures are not likely to reduce in the short term, as the Government has indicated a continual tightening of funding increases during the next several years. Additionally, financial sustainability is an increasing concern given the ageing population, significant building and clinical equipment replacement costs, remuneration pressures, and public expectations of the health sector.
3.24
The financial performance of the DHB sector for 2009/10 was an overall deficit of $102.1 million (2008/09 deficit: $155.1 million), against a budgeted deficit of $115.4 million. Although the aggregate deficit for the sector is lower for 2009/10 than for 2008/09, we are concerned that 14 out of 20 DHBs were in deficit in 2009/10, compared with 13 out of 21 in 2008/09. The highest deficit, both budget and actual, was Capital and Coast DHB ($47.5 million).
3.25
DHBs have been actively working to make savings and set up a sustainable model of service delivery that will allow them to achieve a break-even position. However, this is unlikely in the short term. Figure 10 summarises the actual and forecast financial position for the DHB sector from 2008/09 to 2012/13.
Figure 10
Actual and forecast financial position for the DHB sector
| 2008/09 | 2009/10 | 2010/11 | 2011/12 | 2012/13 | |
|---|---|---|---|---|---|
| Actual $million |
Actual $million |
Estimated $million |
Forecast $million |
Forecast $million |
|
| Total deficit | (155.1) | (102.1) | (76.5) | (39.9) | (17.0) |
3.26
As part of the 2009/10 audit, all appointed auditors considered the appropriate application of the going concern assumption for individual DHBs. The individual DHBs and our auditors relied on a "letter of comfort" from the Ministers of Health and Finance in concluding that the going concern assumption was appropriate for Capital and Coast, Southern, Wairarapa, West Coast, and Whanganui DHBs.
Assessment of environment, systems, and controls in district health boards
3.27
As part of the annual audits, the Auditor-General also comments on DHBs' management control environment, financial information systems and controls, and service performance information and associated systems and controls, to highlight areas for improvement. We assign grades that directly represent the recommendations for improvement.
3.28
Part 3 of Volume 1 of our report to Parliament on the results of the 2009/10 central government audits sets out the environment systems and controls framework, and the grades we use.7
3.29
Our auditors' approach and the standards they apply reflect the unique circumstances of each DHB in each financial year. DHBs vary in size and organisational structure, and sometimes undergo restructuring or other organisational changes.
3.30
Grades for a particular DHB may fluctuate from year to year. Some of the factors that may cause fluctuations include changes in the operating environment, standards, good practice expectations, auditor emphasis, and whether the entity has kept pace with good practice expectations for similar entities between one year and the next. Consequently, the long-term trend in grade movement is a more useful indication of progress than year-to-year grade changes. For these reasons, we advise caution when comparing grades between years.
3.31
Figures 11-13 set out our grades for DHBs' management control environment, and financial information systems and controls, for the year ended 30 June 2010 and the three previous years. We discuss changes in non-financial performance reporting more fully in the following section.
3.32
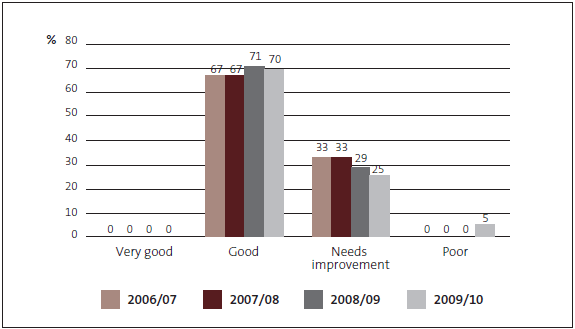
Our auditors assessed most of the DHBs as "good" for the management control environment and for financial information systems and controls (see Figure 11) for 2009/10. The rating of "poor" for Whanganui DHB for 2009/10 was related to a deficiency arising when its computer system was upgraded.
Figure 11
Summary of district health boards' 2009/10 grades for environment, systems, and controls
| District health board | Management control environment | Financial information systems and controls | Service performance information and associated systems and controls |
|---|---|---|---|
| Auckland | Good | Good | Needs improvement |
| Bay of Plenty | Good | Good | Needs improvement |
| Canterbury | Good | Good | Needs improvement |
| Capital and Coast | Needs improvement | Needs improvement | Poor |
| Counties Manukau | Good | Good | Needs improvement |
| Hawke's Bay | Good | Good | Needs improvement |
| Hutt Valley | Good | Needs improvement | Needs improvement |
| Lakes | Needs improvement | Needs improvement | Needs improvement |
| MidCentral | Good | Needs improvement | Needs improvement |
| Nelson-Marlborough | Good | Good | Needs improvement |
| Northland | Good | Good | Needs improvement |
| South Canterbury | Good | Good | Needs improvement |
| Southern | Good | Good | Poor |
| Tairawhiti | Needs improvement | Needs improvement | Poor |
| Taranaki | Good | Good | Needs improvement |
| Waikato | Needs improvement | Good | Poor |
| Wairarapa | Good | Good | Poor |
| Waitemata | Good | Good | Poor |
| West Coast | Good | Good | Poor |
| Whanganui | Poor | Poor | Poor |
3.33
We are disappointed that results for management control environment and financial information systems and controls for DHBs have not altered to any extent during the last four years (see Figures 12 and 13). Most SOEs and other Crown entities achieved a "very good" rating for management control environment during the last four years. Many were also rated "very good" for financial information systems and controls for 2009/10, showing steady improvement during the last four years (see Part 2).
Figure 12
Assessment of management control environment 2006/07 to 2009/10
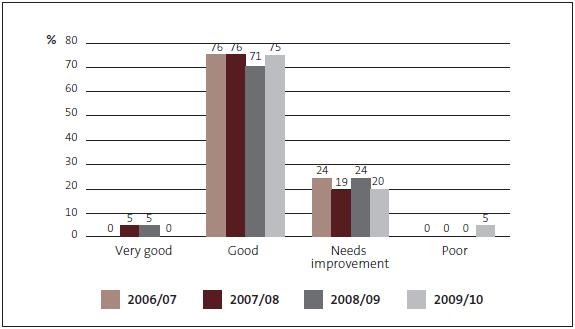
Figure 13
Assessment of financial information systems and controls 2006/07 to 2009/10
Non-financial performance reporting
3.34
In 2008/09, we issued a grade for entities' service performance information and associated systems and controls for the first time. We graded all DHBs as "poor/needs improvement". DHBs did not identify clearly or comprehensively the services that they delivered, and the quality of measures for outcomes and for the services provided was poor.
3.35
We have graded DHBs' non-financial reporting for the second time in 2009/10. We are aware that the DHB sector is carrying out extensive work to improve DHBs' non-financial reporting, and accountability frameworks and guidance.
3.36
Our focus in the 2009/10 audit was on whether each DHB's service performance information presented a clear, logical, understandable, integrated, and cohesive performance story in an informative context. Relevance to the DHB's strategic priorities should also be apparent. Performance reports produced to a satisfactory standard should provide a basis for assessing the DHB's efficiency (of service delivery) and effectiveness (in achieving intended outcomes). The link between financial information and good quality non-financial performance information should provide a basis for assessing cost-effectiveness.
3.37
In our 2009/10 audit of DHB non-financial performance reporting, we concluded that, overall, the quality of DHBs' non-financial performance reporting had improved. However, this is not yet reflected well in the ratings, with no DHB achieving a "good" rating. Improvements were evident in the following areas:
- The DHBs were generally better than in previous years at describing services.
- Most were reporting more, though not necessarily better, performance measures.
- Some were showing aspects of better practice, which are being used as examples for the sector of:
- clearer, more cohesive logical frameworks; and
- more clarity about the difference between outputs and impacts/outcomes.
3.38
Figure 14 shows the audit results for 2008/9 and 2009/10.
Figure 14
Service performance information and associated systems and controls 2008/09 and 2009/10
| Grade | Number (%) of DHBs | |
|---|---|---|
| 2008/09 | 2009/10 | |
| Very good | 0 | 0 |
| Good | 0 | 0 |
| Needs improvement | - | 12 (60%) |
| Poor/needs improvement | 21 (100%) | - |
| Poor | - | 8 (40%) |
3.39
The main areas for improvement are:
- Most DHBs are still not good at explaining the services they deliver.
- Many DHBs still do not have main measures of outcomes.
- Many DHBs do not adequately cover all their significant services, and are not describing outputs concisely and with enough detail.
- Measures of service quality in all DHBs' SOIs are deficient.
- There is a lack of comparative performance information, especially trends.
Procurement policies and practice
3.40
Procurement is critical to the effectiveness and efficiency of DHBs. It covers all the business processes associated with purchasing supplies and health services and the management of contracts for those supplies and services. DHBs have a significant level of procurement activity.
3.41
In past years, appointed auditors have reviewed DHBs' procurement policies and practices. Although procurement policies and practices are improving, this continues to be an area of risk. Our 2009/10 annual audit work included a follow-up of issues raised previously as part of individual audits. We summarise below the findings from that work. Some DHB procurement policies and practices still need to be improved.
3.42
In September 2010, we published Spending on supplies and services by district health boards: Learning from examples.8 Our report was based on systematic work in all DHBs as part of the annual audit and more in-depth work with five DHBs.
Improving procurement policies
3.43
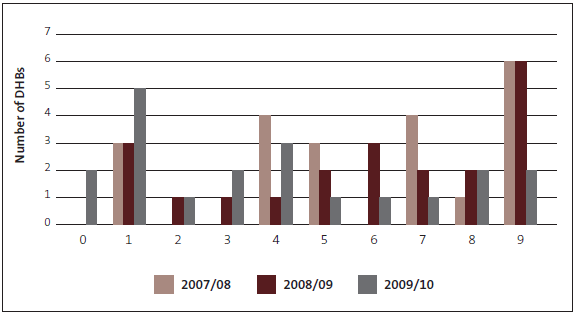
There are nine key aspects to procurement policies. These are status/availability, general provisions, planning and methods, legal considerations, ethical provisions, economic considerations, sustainability, risk management, and processes and management. Figure 15 shows that, in the nine key aspects, DHBs had fewer deficiencies than previously, and two DHBs had no deficiencies. However, two DHBs were still deficient in all nine areas.
Figure 15
Number of deficient aspects of procurement policy
3.44
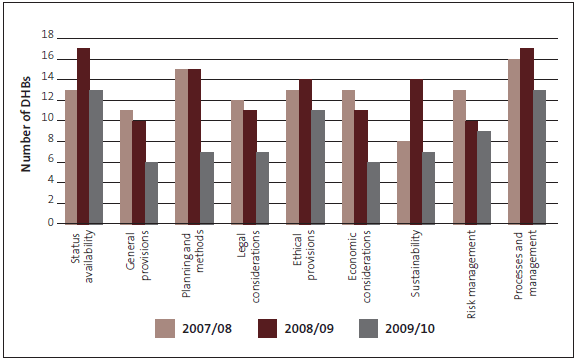
We examined each of the nine key aspects of procurement policy, and we note that fewer DHBs had deficiencies in each aspect, when compared to earlier years.
3.45
Figure 16 shows the particular areas in which DHB procurement policies were deficient.
Figure 16
Number of district health boards with procurement policy deficiencies, by aspect
Improving procurement practice
3.46
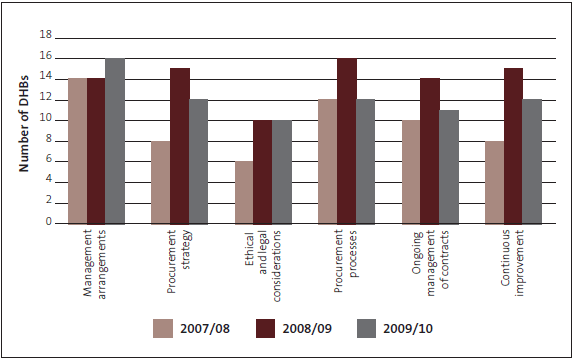
Six aspects of procurement practice have been identified as representing best practice. These are management arrangements, procurement strategy, ethical and legal considerations, procurement processes, ongoing management of contracts, and continuous improvement. One fewer DHB had deficiencies in all six areas of procurement practice than last year, but, overall, there has been little change from past years. In Figure 17, we show the number of DHBs with deficient aspects of procurement practice.
Figure 17
Number of deficient aspects of procurement practice
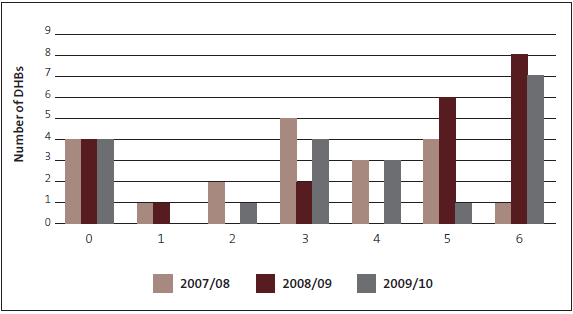
Note that we include 2007/08 data for 20 out of 21 DHBs.
3.47
The number of DHBs with deficiencies in their procurement strategy and processes and management of contracts has reduced (see Figure 18), and more DHBs now use a continuous improvement approach.
Figure 18
Number of district health boards with procurement practice deficiencies, by aspect
Asset management planning
3.48
Our auditors have been reviewing asset9 management plans prepared by DHBs to check that information aligns with asset information in the financial statements. They also checked whether the asset management planning was an appropriate part of each DHB's management control framework.
3.49
DHBs manage assets with a net book value of $4.6 billion10 and a replacement value of $7 billion11. Good asset management is the process of achieving whole-of-life effectiveness of assets at least cost. It requires the DHB to manage a clear strategy for future capital and operating expenditure on the assets to address the risk of ineffective spending and asset failure.
3.50
During the 2008/09 and 2009/10 annual audits, our auditors reviewed and provided feedback to the DHBs on their asset management planning. Our recommendations to DHBs in 2009/10 included:
- ensuring that there is quality asset management planning to underpin the business, and ultimately delivering appropriate levels of service;
- ensuring that the asset management plan contained the financial forecasts;
- updating the asset management plan to reflect the current asset base, and hospital redevelopments;
- reviewing asset information for asset type, age, size, location, performance, monitoring and condition, maintenance history, and cost; and
- improving the asset management life-cycle approaches (for example, lowest long-term costs rather than short-term savings) when making asset management decisions.
3.51
In addition, auditors reviewed all of the DHBs' plans jointly for quality and completeness. Overall, the plans did not put service levels at the heart of asset management planning. They focused on capital planning rather than considering all the types of expenditure needed on the assets. In some cases, the plans did not set out a sustainable approach to funding work required on the assets.
3.52
This high-level desktop review also found that six DHBs had asset management plans that met a good standard of quality and completeness, nine DHBs had plans that largely met Ministry requirements, and only five DHBs had plans that generally did not meet the requirements. We intend to carry out further work in 2011/12 to examine the extent to which the quality of asset planning is reflected in the actual quality of asset management at district, regional, and national levels.
3.53
Accuracy of information about a DHB's assets is critical to a good asset management plan. Recording the details of the condition and expected life of assets allows decisions to be made about which assets need to be retained, redeveloped, modified, used for other purposes, or disposed of. We expect all DHBs to be working towards setting up and maintaining comprehensive asset information.
3.54
During the 2009/10 annual audits, our auditors' recommendations to DHBs included reviewing asset information for asset type, age, size, location, performance, monitoring and condition, maintenance history, and cost.
Learning from examples
3.55
DHBs have, generally, shown small but promising improvements in the areas of non-financial performance reporting and in procurement policies and practice. We are pleased to note, in particular, the improvements in procurement policies.
3.56
We have summarised our observations in these areas into two "learning from examples" publications, aimed at sharing better practice within the sector. These are: Spending on supplies and services by district health boards: Learning from examples (September 2010), and District health boards: Learning from 2010-13 Statements of Intent (February 2011). We intend to look further in the coming year at the area of asset management.
3.57
We remain concerned that such a large proportion of the DHBs were in deficit at the end of the 2009/10 financial year. However, the estimated deficit for 2010/11 and for the two out-years is reducing. We will monitor the financial performance of the DHBs and any implications that might have for the sustainability of their services.
5: Health Sector Information Supporting the Estimates of Appropriations for the Government of New Zealand for the year ending 30 June 2011, parliamentary paper B.5A Vol.6, page 8.
6: Central government: Results of the 2008/09 audits, parliamentary paper B.29[10a], Part 7.
7: Central government: Results of the 2009/10 audits (Volume 1), December 2010, available at www.oag.nz/central-govt/2009-10/.
8: See www.oag.govt.nz/2010/dhbs-spending.
9: "Asset" comprises all of the DHB's physical components (property, plant, and equipment) that have value, enable services to be provided, and have an economic life (Source: NAMS International Infrastructure Management Manual, 2006 Edition).
10: From the annual reports of the 20 DHBs.
11: Transitional DHB National Asset Management Plan, November 2009, page 29.
page top