Part 3: Summary of our conclusions
3.1
In this Part, we discuss our conclusions about whether the eight local authorities were effectively managing their drinking water to meet forecast demand.
3.2
Our conclusions are based on the forecasting techniques the local authorities used, the strategies they had chosen, and how they were implementing those strategies. We discuss forecasting in more detail in Part 4. In Part 5, we discuss how the local authorities implement legislation and national (and regional) policies and plans. In Parts 6 and 7, we discuss the strategies that the local authorities used.
Our overall findings
3.3
Three of the eight local authorities (Nelson City Council, Tasman District Council, and Tauranga City Council) were effectively managing their drinking water supplies. They were well placed to meet the forecast demand for drinking water.
3.4
Three of the eight local authorities (Christchurch City Council, Opotiki District Council, and Kapiti Coast District Council) were adequately managing their drinking water supplies, and were adequately placed to meet the forecast demand. They had more to do to improve the accuracy of forecasts and implement strategies.
3.5
Two of the eight local authorities (South Taranaki District Council and Central Otago District Council) were poorly managing their drinking water supplies, and were poorly placed to meet the forecast demand. They had a significant amount of work to do to improve forecasts and upgrade drinking water supply infrastructure.
3.6
It is important to note that those local authorities in an adequate or poor position to meet the forecast demand for drinking water had identified how they would improve the effectiveness of their management and were implementing those improvements. Provided they continue, within the next 10 years they should be in a position to effectively manage the supply of drinking water to meet the forecast demand.
3.7
Each local authority's capacity to meet the forecast demand for drinking water was, broadly, related to their size. Generally, the smaller the local authority, the more limited the forecasting, the bigger the challenges faced, and the more expenditure (per connection to the water supply) planned to address the risks and challenges. The exception to this was Opotiki District Council, which was in a unique position for reasons we discuss in paragraph 3.16.
3.8
The particular context of each local authority was also a strong influence. For example, although Christchurch City Council is the largest of the eight local authorities, its forecasting was not as developed as some of the other local authorities. The incentives to improve forecasting have been weak because Christchurch City Council has access to a groundwater source in a quantity that exceeds current and anticipated demand until 2051.
3.9
We discuss our conclusions about each local authority in more detail in the rest of this Part. Figure 3 summarises the factors we considered in reaching our conclusions.
Figure 3
Summary of factors considered in assessing how the eight local authorities were managing their drinking water
| Local authority | Location | Current ability to manage supply to meet demand | Forecasting demand | Planning to meet future demand | Quality of drinking water (Capacity to comply with the drinking water standards |
|---|---|---|---|---|---|
| Tauranga City Council | 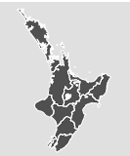 |
Effective | Forecasting is reasonably detailed and likely to be accurate | Planning is good and implementation is consistent | Graded Aa for drinking water standards in 2005 but requires minor upgrades to comply with the current drinking water standards |
| Existing supply is insufficient to meet projected demand Has identified an additional source of supply and has applied for necessary resource consents |
Uses universal water metering and charging plus a number of other initiatives to manage demand | ||||
| Ongoing investment in infrastructure renewals and upgrades Significant investment in new supply to meet forecast future demand |
|||||
| Nelson City Council | 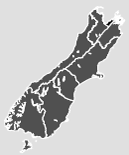 |
Effective | Forecasting is reasonably detailed and likely to be accurate | Planning is good and implementation is consistent | Currently graded Ab Planning to improve distribution grading |
| Existing supply is sufficient | Uses universal water metering and charging to reduce demand | ||||
| Ongoing investment in infrastructure renewals and upgrades | |||||
| Tasman District Council | 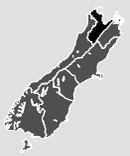 |
Effective | Forecasting is reasonably detailed and likely to be accurate | Planning is satisfactory and improving, early stages of commitment to implementation Strategy to meet demand is based on supply augmentation |
Currently ungraded and requires upgraded infrastructure (additional filtration and disinfection) to comply |
| Existing supply is insufficient to meet projected demand Investing in dams to provide an additional source of supply |
Uses universal water metering and charging in all urban supplies to reduce demand. This affects about 90% of the total number of water users. Also developing other conservation measures |
||||
| Significant investment in infrastructure renewals and upgrades required | |||||
| Kapiti Coast District Council | 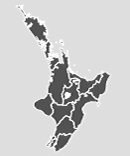 |
Adequate | Forecasting is adequate but data could be improved | Planning is satisfactory but implementation is sometimes limited by changes in policy Strategy to meet demand is based on supply augmentation and demand management |
Currently ungraded and requires upgraded infrastructure (UV treatment) to comply |
| Uses voluntary conservation to reduce demand. New homes will be required to install rainwater tanks and/or greywater* systems Also developing other demand management measures |
|||||
| Existing supply is generally sufficient to meet projected demand now; but, in some parts of the district, by 2015/16, summer demand is projected to exceed the amount that can be legally taken under resource consents Has decided to increase supply |
Some investment in infrastructure renewals and upgrades required | ||||
| Opotiki District Council | 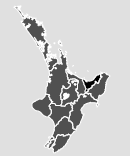 |
Adequate | Forecasting is limited | Planning is limited | Currently ungraded and requires upgraded infrastructure (UV treatment) to comply |
| Existing supply is sufficient to meet projected demand | Has universal metering and charging and developing other conservation measures | ||||
| Little investment in infrastructure renewals and upgrades | |||||
| Christchurch City Council | 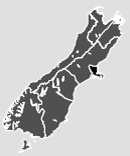 |
Adequate | Forecasting is currently limited by incomplete data, but developing a demand forecasting model | Planning is satisfactory and improving Adopted a water supply strategy for 2009-2039 that includes more demand management tools |
Currently graded Ba and Da for Christchurch City and Ee for Banks Peninsula supplies Requires upgraded infrastructure to comply in Banks Peninsula |
| Existing water supply is sufficient to meet projected demand until about 2051 | Few tools currently used for reducing demand. Metering but only commercial and industrial consumers are charged | ||||
| Ongoing investment in infrastructure renewals and upgrades | |||||
| Central Otago District Council | 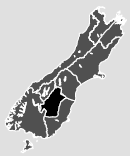 |
Poor | Forecasting is limited by incomplete data; particularly needs accurate water consumption data | Planning is improving but early stages of commitment to implementation Has adopted the Central Otago Drinking Water Strategy 2007 which, if implemented, should improve the situation |
Currently ungraded and requires upgraded infrastructure (treatment plants) to comply |
| Existing supply is sufficient to meet projected demand though Council anticipated future restrictions Possible pressure when resource consents for taking surface water are due for renewal because consumption is very high |
Currently using some tools for reducing demand but progressively implementing metering and charging | ||||
| Significant investment in infrastructure renewals and upgrades required | |||||
| South Taranaki District Council | 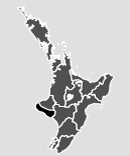 |
Poor | Forecasting is limited by incomplete data; particularly needs accurate water consumption data | Planning is improving but early stages of commitment to implementation Has adopted a District Water Supply Strategy (2007) which, if implemented, should improve the situation |
Currently ungraded and requires upgraded infrastructure (treatment plants) to comply |
| Existing supply is insufficient to meet projected demand Additional sources of supply difficult because of pressure on supply from drought, few groundwater resources, and surface water in some catchments being at or near full allocation |
Currently using some tools for reducing demand, including working with farmers, education, and progressively implementing metering | ||||
| Significant investment in infrastructure renewals and upgrades required |
* Greywater is wastewater that we generate in our homes (for example, dishwashing water, laundry water, and bathwater).
Conclusions about each of the eight local authorities
3.10
We have grouped the eight local authorities according to how well they were managing their drinking water supplies. Three local authorities were effectively managing, three were adequately managing, and two were poorly managing their drinking water supplies.
Local authorities effectively managing their drinking water
3.11
Tauranga City Council is effectively managing its drinking water supply, and is well placed to meet the forecast demand for it. The Council has detailed forecasting and up-to-date data about its asset management systems. It has identified water supply challenges and it uses a full range of strategies for managing for demand. It has consistently implemented the strategies and is constantly assessing, revising, and improving its strategies.
3.12
Nelson City Council is effectively managing its drinking water supply, and it too is well placed to meet the forecast demand for it. The Council has identified water supply challenges and has strategies in place to upgrade its systems for reticulation, asset management, backflow prevention, and managing water loss. The Council has enough water sources and a modern treatment plant. It is dealing with the risks it has identified with its main pipeline between water sources and the treatment plant. It has sound forecasting techniques and is putting in place a range of strategies to meet the forecast demand.
3.13
Tasman District Council is also effectively managing its drinking water supply, and it too is well placed to meet the forecast demand for drinking water. It has sound forecasting techniques and is putting in place a range of strategies to meet the forecast demand. Although both the quantity and quality of its drinking water supply are problematic, it understands the challenges and is using both supply and demand strategies to address those challenges. The Council has a strong focus on demand management and water conservation. It has also identified the upgrades it needs to make to its existing water supply systems and has started to implement them. It has implemented a water augmentation project and is planning more (for example, dams to increase storage) to resolve the supply issues.
Local authorities adequately managing their drinking water
3.14
Kapiti Coast District Council is, currently, adequately managing its drinking water supply to meet future demand. It is able to adequately forecast future demand for drinking water. However, the accuracy of its forecasts would be increased by improving some of the data used. Under the umbrella of the 2003 Sustainable Water Management Strategy, the Council is using a range of supply and demand strategies to address its drinking water supply challenges.
3.15
However, by about 2015/16, in Waikanae, Paraparaumu, and Raumati, the Council expects demand during summer to exceed the amount of water it can legally take on a regular basis under its resource consents. It has decided to increase supply and expects to make a decision in June 2010 on what option to implement. The Council is also committed to reducing consumption and uses a number of demand management tools, some of which are innovative (for example, a regulatory tool requiring the use of greywater systems in new homes). It has also set a standard to limit the amount of water supplied. However, progress towards that standard is slow and the overall impact of demand management strategies seems to be limited. The current council and previous councils have had difficulty achieving a clear consensus in the community about how to reduce consumption and resolve the supply issues.
3.16
Opotiki District Council is able to meet the forecast demand for drinking water even though its forecasting and planning is relatively limited. The Council upgraded its main drinking water supply system within the past 15 years. The new water supply was built with additional capacity to provide for future growth. It can treat more than two times the current average daily demand. The Council also has access to enough water sources. The investment in a relatively large water supply system has helped to ensure that the Council has enough supply to meet demand now and in the future. There are few immediate financial incentives for the Council to prepare detailed forecasts or manage water consumption more conservatively.
3.17
Christchurch City Council is able to meet the forecast demand for drinking water because it uses less water than it has available. The Council has resource consents that allow it to take up to 40% more water than it is currently using. Because of this, and because much of its water supply is inexpensive to provide, there are few immediate financial incentives for the Council to prepare detailed forecasts or manage water consumption more conservatively. However, the Council has prepared a 30-year water supply strategy and began implementing the strategy toward the end of 2009.
Local authorities poorly managing their drinking water
3.18
Central Otago District Council is poorly placed to meet the forecast demand for its drinking water. Both the quantity and quality of drinking water supply are problematic. The Council's water supply infrastructure needs upgrading, partly to comply with the drinking water standards and partly to improve the efficiency of its water supply systems. The Council needs to reduce the excessive water consumption patterns in its district to reduce how much it will need to spend on upgrading its water supply infrastructure. Its asset management information is also incomplete. The Council has identified the improvements needed to upgrade its water supply systems. It has also started to implement those projects. Provided this progress continues, the Council should be in a position to manage demand effectively in the future (from about 2015).
3.19
South Taranaki District Council is also poorly placed to meet the forecast demand for its drinking water. In our view, meeting demand in South Taranaki is more about providing an appropriate quality of drinking water and matching demand to supply in the future than providing for new growth. The Council's water supply infrastructure needs upgrading, partly to comply with the drinking water standards and partly to improve the efficiency of its water supply systems. Its asset management information is also incomplete though improving. However, the Council has identified the improvements needed to upgrade its water supply systems, starting with projects to improve its asset management information and to understand the extent of the problems it faces. It has also started to implement those projects. Provided this progress continues, the Council should be in a position to manage demand effectively in the future (from about 2015).
