Part 3: Trends, issues, and observations from the 2006-16 LTCCPs
3.1
In this Part, we discuss our analysis of the main financial trends projected in the 2006-16 LTCCPs. This includes:
- the effect of including price change in the 2006-16 LTCCPs;
- analysing forecasts made in the 2006-16 LTCCPs;
- comparing the 2006-16 LTCCP Statements of Proposal to the final LTCCPs;
- comparing the 2004-14 LTCCPs to the 2006-16 LTCCPs; and
- our conclusions.
3.2
LTCCPs include forecast financial statements for the next 10 years. These are forecasts only and therefore will differ from the actual financial results achieved in those years. However, in aggregate, the forecasts provide a useful picture of the size of, and trends occurring in, local government finances and their implications for planning. Given our role, we were in an ideal position to aggregate this information to provide a snapshot of the future from the combined LTCCPs.
3.3
We note that there is scope for further substantial and detailed analysis of this information. This Part seeks only to highlight the main trends, issues, and observations about LTCCPs.
3.4
For our analysis, we collated local authorities’ financial data from:
- 2004-14 final LTCCPs1 (sourced from the Treasury);
- 2006-16 LTCCP Statements of Proposal issued for consultation;
- 2006-16 final LTCCPs; and
- 2005/06 annual plans.
The effect of including price change in the 2006-16 LTCCPs
3.5
When reviewing the financial information included in the 2006-16 LTCCPs, readers need to consider the effect of price change,2 which estimates the real increase in the cost of local authorities’ operations during the planning period and which will also have a real effect on rating levels.
3.6
Financial Reporting Standard 42: Prospective Financial Statements (FRS-42) requires prospective financial information and the assumptions used to prepare it to be based on the best and reasonable information available to the entity. The assumptions and resulting information must be reasonable and supportable.
3.7
Local authorities prepared the financial projections included in the 2004-14 LTCCPs on the assumption that the value of money would not change over time. Under FRS-42, this assumption was considered unsupportable as historical evidence and current forecasts suggested that cost increases were probable in the future. Local authorities were therefore required to include price change in their financial projections in the 2006-16 LTCCPs to meet the reasonable and supportable test in FRS-42.
3.8
To help local authorities prepare their 2006-16 forecasts, the Society of Local Government Managers (SOLGM) engaged the Bureau of Economic Research Limited (BERL) to provide a forecast of probable price change for the 10 years covered by the LTCCP. As an example, the cumulative effect of BERL’s indices suggested that staffing costs would be 19.5% higher in 2016 than in 2006, and water activity costs would be 35% higher.
3.9
Local authorities generally used the BERL forecasts to prepare their financial information. Some used their own forecasts of price change. Irrespective of the source of the price change assumptions, including price change had a substantial effect on the financial forecasts in the 2006-16 LTCCPs.
3.10
FRS-42 also requires local authorities to apply their accounting policies to the financial forecasts. Because of this requirement and the assumption that prices change over time, local authorities were required to forecast the change in asset values and resulting depreciation from the periodic revaluation of property, plant, and equipment, such as land and buildings, roads, water, and stormwater and wastewater infrastructure assets.
3.11
While revaluations substantially affect the Statement of Financial Position, the most significant implication is for depreciation. Depreciation represents the extent to which the service potential of a local authority’s assets has been consumed. The balanced budget test in section 100 of the Act requires that operating revenues be set to cover operating expenses, which includes asset consumption represented by depreciation.3
3.12
Revaluing assets results in a depreciation figure based on current replacement costs rather than historic costs. In an inflationary environment, this results in increases in depreciation expenses.
3.13
If assets are not revalued, depreciation is calculated on a historic cost basis, and it is arguable that the current community does not pay the full cost of the consumption of the asset. This approach leaves a significant shortfall that a later generation must fund when the asset requires replacement.
Analysis of forecasts made in the 2006-16 LTCCPs
3.14
The 2006-16 LTCCPs forecast a substantial increase in cumulative local authority size by 2016. The main financial forecasts are:
- Rates increase from $3,100 million in 20064 to $5,300 million in 2016 (up 71%).
- Local authority surpluses double from $667 million in 2006 to $1,300 million in 2016. Cumulatively, surpluses total $12,000 million during the 2006-16 period.
- Overall, equity increases by more than 40% to $101,000 million.5
- Local authorities’ investment in property, plant, and equipment increases to $98,000 million in 2016, up from the $56,000 million estimated in 2005/06 annual plans.
- Public debt increases from $3,200 million estimated in the 2005/06 annual plans to $8,200 million (up 154%) in 2016 forecast in the LTCCPs.
- Capital expenditure of $29,500 million for the 10 years of the LTCCPs.
- Local authority cash investments (including bank balances) increase by $900 million during the 10 years of the LTCCPs.6
Operating expenditure
3.15
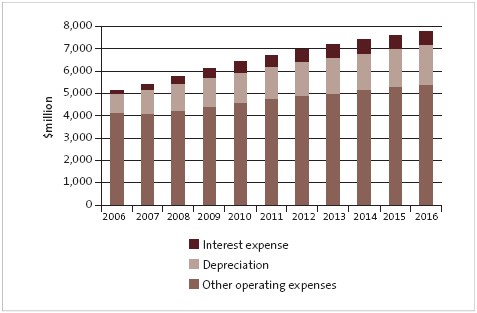
Figure 3 shows that operating expenditure is forecast to increase by 44% overall. The overall increase in operating revenues (including rates) is 82% (see Figure 4).
Figure 3
Forecast operating expenditure from 2006 to 2016
Note: The 2006 amount comes from 2005/06 annual plans.
3.16
By component, other operating expenses are forecast to increase by 30%, depreciation by 113%, and interest expense by 327%.
3.17
Depreciation more than doubles as a result of revaluations and asset additions during the 10 years covered by the LTCCPs.
3.18
Interest expense is forecast to increase substantially as local authorities take on more debt to finance the purchase of assets. The interest increase appears disproportionate to the increase in debt, but this is because of the significant increase in debt in the early years of the LTCCPs.
Operating revenues
3.19
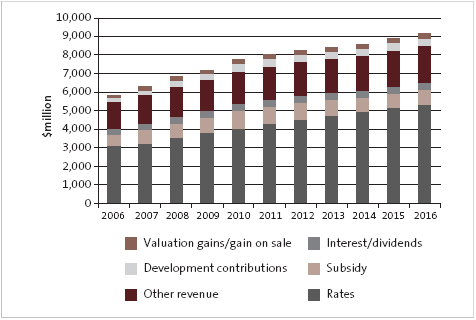
The 2006-16 LTCCPs forecast a substantial increase in rates and an increasing use of some of the other funding sources available to local authorities. For example, development contributions revenue (used to finance growth-related capital expenditure) is forecast to nearly double from $216 million in 2006 to $423 million in 2016.
3.20
While, on average, development contributions are expected to form about 5% of revenue for the overall sector, they represent up to 20% of all revenues for local authorities in high growth areas.
3.21
Despite increases from other revenue sources during the 10 years covered by the LTCCPs, rates are anticipated to increase by 6% relative to other operating revenue sources - that is, from 53% to 59% of all operating revenue. Figure 4 summarises the forecast operating revenues from the 2006-16 LTCCPs.
Figure 4
Forecast operating revenues from 2006 to 2016
Note: User-pays charges are included as "other revenue". The 2006 amount comes from 2005/06 annual plans.
3.22
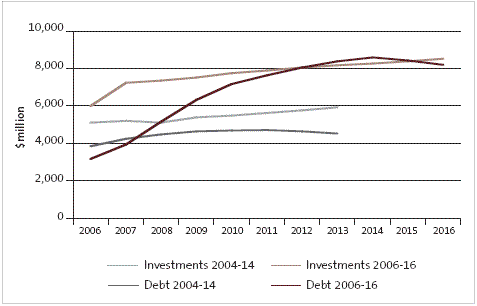
The proportionate increase in rates revenues may reflect that rates are a primary funding source for capital expenditure as well as operating expenditure. This increases the sensitivity of rating figures to increases in size and cost (including price change) within the operating and capital expenditure programmes.
3.23
It should also be noted that the sizeable "other revenue" stream, which is primarily user-pays charges, is typically linked to operating expenditure and not capital expenditure (for example, resource consent charges). On the other hand, to meet critical non-financial objectives in providing a service (for example, libraries or other sporting, leisure, or cultural facilities), "other revenue" might not be set to recover total operating costs, including depreciation. This may contribute to rates increasing proportionately more than other revenue sources.
3.24
It is also possible that there may be an element of conservatism in the forecasts for "other revenue" streams, or that local authorities have given limited consideration to the appropriateness of non-rates revenue requirements in the later years of the LTCCP given the cost increases forecast.
Surpluses
3.25
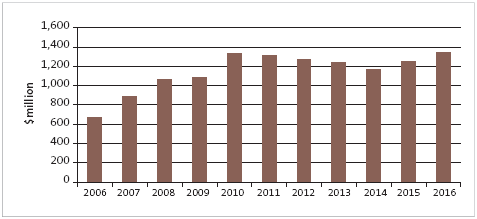
The total of the surpluses forecast in local authorities’ 2005/06 annual plans was $667 million. The total forecast surplus is $883 million for 2006/07, the first year of the LTCCP, and exceeds $1,000 million for both 2007/08 and 2008/09. After that, the total surpluses forecast by the sector drop below $1,200 million only once in the seven remaining years of the LTCCP.
3.26
Figure 5 shows that the surpluses forecast in the first three years of the LTCCPs are comparatively lower than the remaining years of the plans.
Figure 5
Forecast surpluses from 2006 to 2016
Note: The 2006 amount comes from 2005/06 annual plans.
3.27
Analysing the surpluses further, fewer than 10% of local authorities had surpluses that generally decreased during the 10 years covered by the LTCCPs. The majority of local authorities forecast surplus levels that were generally constant between years or that increased during the 10 years of the plan.7
Capital expenditure and non-rate financing mechanisms
3.28
To understand the overall local authority financial forecasts in the LTCCP, operating revenues and surpluses should not be viewed in isolation. Surpluses include non-cash items, such as vested assets. They also include revenue sources - such as development and financial contributions, some grants and subsidies, and (in some instances) rates - that are to be used to purchase capital items. In addition, local authorities need to consider using other funding sources - such as debt, reserves, and investments or cash balances - to fund capital expenditure.
3.29
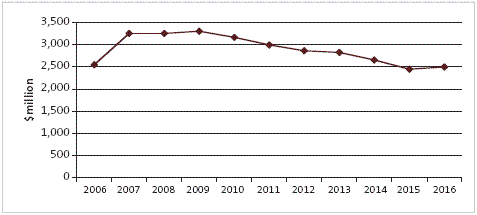
The LTCCPs forecast a total of $29,500 million of capital expenditure for the 2006- 16 period. There is a marked decrease in capital expenditure forecast for the later years of the plan. Figure 6 shows the capital expenditure forecast for each year of that period.
Figure 6
Forecast capital expenditure from 2006 to 2016
Note: The 2006 amount comes from 2005/06 annual plans.
3.30
The 2006-16 LTCCPs forecast an increase in the use of external debt to fund capital expenditure. The net movement in debt shown in the Statements of Financial Position is $5,000 million.8 Of the overall increase in debt, Auckland City Council accounts for $1,200 million.
3.31
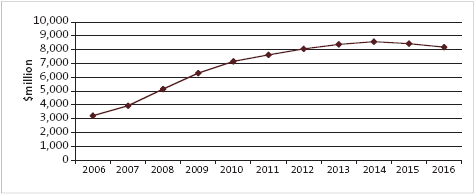
External debt levels are forecast to increase in the early years of the LTCCPs, with net local authority external debt increasing by more than $1,000 million a year for the three years from 2007 to 2009 and then levelling out. External debt decreases in the later years of the LTCCPs.
3.32
Typically, the increased use of debt went hand in hand with increased surpluses, which is not unexpected given that both are used to finance capital expenditure. The increased surpluses and debt were especially prevalent in larger city and district councils.
3.33
Of the nine local authorities that showed no or minimal debt balances (less than $300,000) in their LTCCPs, six had forecast reasonably constant and relatively small surpluses. Of those local authorities, two were regional councils and four were small district councils. Figure 7 shows forecast external debt from 2006 to 2016.
Figure 7
Forecast external debt from 2006 to 2016
Note: The 2006 amount comes from 2005/06 annual plans.
3.34
Many local authorities include a threshold of interest expense as a proportion of rates revenue or total revenue within their liability management policy. These thresholds provide a boundary within which local authorities manage their debt levels - in this instance, by determining the level of debt-servicing costs that the local authority is willing to incur.
3.35
Interest expense was forecast to increase from 7.0% to 11.2% as a proportion of rates and to increase from 3.6% to 6.6% as a proportion of total revenue.9
3.36
However, overall, debt remains at a relatively modest level considering the level of investments and cash held. During each year of the 2006-16 LTCCPs, investments and cash exceed the level of external debt forecast. At the end of the LTCCP period, local authority investments - including cash - are forecast to exceed debt by $1,500 million (investments and cash are forecast to be $9,700 million).
Overall funding - Statement of Cash Flows
3.37
The Statement of Cash Flows reflects the cumulative effect of local authority funding decisions and therefore the use of surpluses.
3.38
Figure 8 shows the cumulative local authority funding forecast in the 2006-16 LTCCPs.
Figure 8
Cumulative local authority funding shown in the 2006-16 LTCCPs
| Cumulative operating cash flows This figure comprises cumulative surpluses and depreciation of $12,000m and $14,600m respectively less adjustments for other non-cash or non-operating cash flow items such as vested assets, forestry, and investment property valuation movements, and gains or losses on sales of assets. |
$24,200m |
| Cumulative asset sales | $700m |
| Cumulative net increase in debt | $5,500m |
| Less cumulative net increase in cash investments and cash | ($900m) |
| Cumulative capital expenditure | $29,500m |
3.39
Figure 8 shows that about 81% of the capital expenditure included in LTCCPs is funded from operating cash flows and asset sales, and 19% is funded from external debt. It also shows that, by the end of 2016, the local government sector will have increased its cash and cash investments by $900 million.
3.40
It should be noted that operating cash flows include development contributions and capital-expenditure-related Land Transport New Zealand subsidies. However, as noted earlier, development contributions amount to only 5% or $3,700 million of forecast revenue in the LTCCPs. Even if all development contributions revenue was excluded from local authority surpluses, there would be a remaining surplus of $8,300 million.
3.41
Analysed on a year-by-year basis, the cash flow information reflects an even more dramatic picture. Figure 9 shows that, in the early years of the LTCCPs, local authorities are funding a significantly higher proportion of their proposed capital programmes from debt and are also using investments and bank balances. In later years, investment and bank balances increase annually and the proportion of debt used as a funding source decreases. Local authorities forecast that, in 2015, they will have enough cash surpluses to cover capital expenditure for the year, repay a portion of debt, and also increase bank and investment balances.
Figure 9
Proportionate funding of net capital expenditure
| 2007 % |
2008 % |
2009 % |
2010 % |
2011 % |
2012 % |
2013 % |
2014 % |
2015 % |
2016 % |
|
|---|---|---|---|---|---|---|---|---|---|---|
| From operations | 55 | 63 | 66 | 79 | 87 | 90 | 93 | 98 | 113 | 117 |
| From debt | 38 | 38 | 36 | 27 | 16 | 15 | 12 | 8 | (5) | (9) |
| Investments and bank funds used |
7 | (1) | (2) | (6) | (3) | (5) | (5) | (6) | (8) | (8) |
3.42
In analysing net capital expenditure, it would have been desirable to know what portion of capital expenditure was attributable to renewals expenditure. Renewals costs are often paid from funded revenue and are set to cover non-cash expenses such as depreciation - the excess cash resulting from a "balanced budget"10 position - with new capital financed by surpluses, reserves, and debt. Nevertheless, forecasts for the later years suggest that all capital expenditure could be financed from operations (that is, surpluses and funded depreciation) regardless of its nature. Local authorities need to consider the intergenerational equity (each generation paying its own way) of such an approach.
Overall summary
3.43
The 2006-16 LTCCPs reflect an increased use of other funding sources, such as development contributions, and intergenerational funding sources, such as debt. However, the forecast rates and operating surpluses continue to increase at significantly higher levels than overall operating costs. There is no clear reason for rates and surpluses of this level. This reflects our broader concern that the financial strategies of local authorities are not necessarily apparent.
3.44
Although debt increases, the levels of debt held by local authorities remain relatively small compared with their asset base, especially considering that investments and cash are forecast to exceed debt in each year of the LTCCP.
3.45
The forecasts reveal a marked change in funding strategies in different years of the LTCCPs. In the first three years, debt funds at least 36% of total capital expenditure. In the later years, the percentage of debt funding decreases substantially, to the extent that it is being repaid rather than borrowed. The rationale for the change in approach - that is, funding capital expenditure from operating cash flows (surpluses and funded depreciation) rather than debt - is unclear.
3.46
The overall position is that 81% of the capital in the LTCCPs is funded from operating sources. This suggests that the costs of new assets, which have benefits over a long term, are being funded by current revenues. This raises questions about the intergenerational equity of the adopted funding approach.
3.47
Given the points identified above, the situation warrants further analysis. Each local authority needs to consider whether its LTCCP adequately reflects its financial strategies, including the rationale for the proposed levels of rates increases and surpluses – in particular, for the later years of the plan.
Comparing the 2006-16 LTCCP Statements of Proposal to the final LTCCPs
3.48
We compared the financial forecasts in the 2006-16 LTCCP Statements of Proposal with the final LTCCPs to see the nature of changes made after the draft plan had been subject to public consultation. This would highlight the effect of decisions made by local authorities between publication of the LTCCP Statements of Proposal and the final LTCCPs.
3.49
The changes occurring to the 2006/07 year’s forecasts in the Statements of Financial Performance between the LTCCP Statements of Proposal and the final LTCCPs were:
- rates decreased by $51 million (down 1.7%);11
- other income increased by $53 million (up 3.6%);
- development contributions, interest, and vested assets increased by $16 million;
- subsidies increased by $27 million (up 3.8%);
- total operating expenditure (including depreciation and interest) increased by $58 million (up 1.1%); and
- the cumulative operating surplus decreased by $15 million (down 1.7%).
3.50
It is unclear why local authorities collectively believed that more "other revenue" would be available after consultation than before consultation ("other revenue" excludes interest, subsidies, and development contributions). This is an area that requires further consideration when we review LTCCP Statements of Proposal in future years.
3.51
The changes occurring to the 2006/07 forecasts in the Statements of Financial Position between the LTCCP Statements of Proposal and the final LTCCPs were:
- property, plant, and equipment (including infrastructure) increased by $57 million;
- investments decreased by $77 million (down 1.1%); and
- debt increased by $41.6 million (up 1.2%).
3.52
In Figure 10, we isolate Auckland City Council forecasts from the changes made by other local authorities between the LTCCP Statements of Proposal and the final LTCCPs. This is because the council’s LTCCP Statement of Proposal included various options for consultation that had significant effects on the proposed capital programme and resulting funding sources, including rates and debt. The option adopted by Auckland City Council for its final LTCCP was a capital expenditure and operating programme of 29 projects at a cost of $2,200 million over the 10 years.
3.53
Although the changes noted in paragraph 3.52 were relatively insignificant in the 2007 year, the Auckland City Council’s LTCCP showed that, by 2016, rates were $171 million more than in the LTCCP Statement of Proposal. In addition, the surplus was up $85 million, assets increased by $2,200 million, and debt rose by $1,200 million. Changes of this size need to be excluded to highlight the changes for the other 84 local authorities.
Figure 10
Changes to the 2016 year of the 2006-16 LTCCPs after consultation on the draft LTCCP Statements of Proposal and over the term of the LTCCPs
| 2016 | 2006-16 | |||
|---|---|---|---|---|
| Including Auckland City Council |
Excluding Auckland City Council |
Including Auckland City Council |
Excluding Auckland City Council |
|
| Rates | $105m 2.0% |
($66m) (1.4%) |
$202m 0.5% |
($592m) (1.5%) |
| Other income | $119m 6.4% |
$81m 4.8% |
$822m 4.8% |
$669m 4.3% |
| Total operating expenditure | $286m 3.8% |
$91m 1.3% |
$1,600m 2.5% |
$626m 1.0% |
| Change in operating surplus | $38m 2.9% |
($47m) (4.1%) |
$841m 7.6% |
($61m) (0.6%) |
| Property, plant, and equipment (including infrastructure assets) | $3,005m 3.1% |
$781m 0.9% |
N/A | N/A |
| External debt | $1,840m 29.0% |
$617m 9.9% |
N/A | N/A |
3.54
Excluding Auckland City Council, the 2016 year information and the cumulative information continues a trend established from the changes to the 2007 information, of an overall lower level of rating off set by increased operating revenues and more infrastructure assets financed by external debt.
Our analysis
3.55
The changes made by local authorities after consultation on the LTCCP Statements of Proposal indicated a focus primarily on the first year of the plan, with the remaining years of the LTCCPs reflecting this trend – that is, lower rates combined with more use of other revenue sources and debt to fund an increased level of asset investment.
3.56
In the context of the overall sector, the changes for the 84 local authorities (that is, excluding Auckland City Council) are individually relatively insignificant. What is interesting to note is that the changes resulted in more operating and capital expenditure, while rates were also reduced.
3.57
A review of the changes between the LTCCP Statements of Proposal and the final LTCCPs suggests that the majority of the changes were made in the first year of the plans, with only minor changes made in later years.
3.58
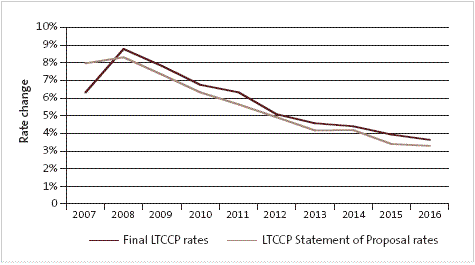
In addition to reducing the overall amount of rates sought, the changes made to rates in 2006/07 lowered the percentage increase in rates for that year from 8.0% to 6.3% (8.1% to 6.0% if Auckland City Council is excluded). The forecast increase in rates for 2008 increased from 8.3% to 8.8% (8.5% to 8.8% excluding Auckland City Council), and a similar small percentage increase was forecast for future years.
3.59
The percentage increase in rates is a typical area of focus for local authorities and ratepayers. The decrease in the first year and no percentage decreases in subsequent years may be the result of taking a short-term view on the LTCCPs. However, this cannot be said with any certainty.
3.60
We will be interested to see whether local authorities seek to change the comparatively high level of rates increases forecast for 2008 through their annual planning processes. If this occurs, it would provide a stronger indication that local authorities are viewing their LTCCPs and decision-making on a short-term basis.
3.61
Figure 11 shows the comparison of forecast rate changes between the LTCCP Statements of Proposal and the final LTCCPs.
Figure 11
Comparison of rates changes forecast in the LTCCP Statements of Proposal with the final LTCCPs
Note: Includes Auckland City Council forecasts.
Comparing the 2004-14 and 2006-16 LTCCPs
3.62
We were aware that the sector acknowledged that it had issues with the completeness of the 2004-14 LTCCPs (and their predecessors, the 10-year long-term financial strategies), especially in the forecasts for the later years of the planning period. While the audits considered the quality of the financial projections at an individual LTCCP level, we also wanted to find out whether some of the issues with the earlier projections remained at a sector-wide level.
3.63
The ideal way to perform this analysis and to see whether the financial forecasts had improved would be to directly compare the information in the 2004-14 and 2006-16 LTCCPs. However, one effect of including price change in the 2006-16 LTCCPs is that a direct comparison of the forecasts between the two LTCCPs is difficult to perform with any accuracy.
Price change
3.64
Failure to include price change was one of the main deficiencies noted in the 2004-14 LTCCPs. It meant that forecast costs in the later years of the LTCCPs were significantly lower than the probable costs that a local authority was going to incur in that year. This made the resulting funding sources, such as rate and debt levels, less meaningful. It also meant that the LTCCPs could not be relied on as a tool for long-term planning or, at least, made them less relevant to decision-making.
3.65
For the 2006-16 LTCCPs, all but one local authority included price change in forecasts of operating and capital expenditure. Another local authority did not include forecasts for the revaluation of infrastructure assets.
3.66
Including the effect of price change does not make the forecasts "correct", since actual costs will inevitably vary from the predicted costs. However, including price change means the forecasts will be closer to the actual costs than if price change had been excluded, enhancing the reliability and relevance of the information contained within the LTCCPs. This gives local authorities a clearer basis on which to determine their approach to managing their finances.
3.67
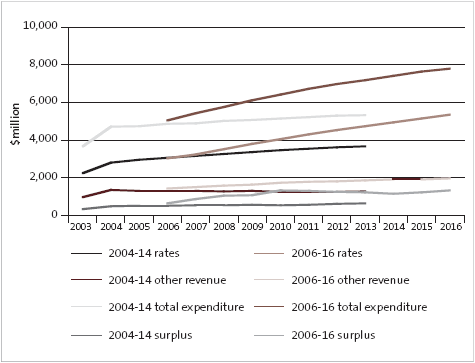
Figure 12 highlights differences between the forecasts included in the 2004-14 and 2006-16 LTCCPs, and shows the significant effect price change had on the forecasts.
Figure 12
Comparison of Statements of Financial Performance in the 2004-14 and 2006-16 LTCCPs
Reliability of forecasts
3.68
One of the main concerns raised about the 2004-14 LTCCPs was the reliability of the financial forecasts in the plans – in particular, an apparent focus on the first year of the plan or at least the first three years of the plan compared to years 4-10. For the 2006-16 LTCCPs, this was overcome in part by including price change.
3.69
Capital expenditure was the most obvious area where the forecasts in the 2004-14 LTCCPs could be questioned. The aggregation of all local authorities’ 2004-14 LTCCP cash flow information showed an increase in capital expenditure between 2003 and 2004 from $1,400 million to $2,100 million. However, capital expenditure decreased from $2,100 million in 2004 to $1,200 million in 2014, which is a reduction of $900 million or 43%.
3.70
Our expectation for the 2006-16 LTCCPs was that we would not see such a decrease in the later years of the plans and that the integrity of capital expenditure forecasts in the later years would have improved. Superficially, however, this does not appear to have been the case. Figures 13 and 14 show the comparisons for capital expenditure and for debt and investment in the 2004-14 and 2006-16 LTCCPs.
Figure 13
Comparison of capital expenditure in the 2004-14 and 2006-16 LTCCPs
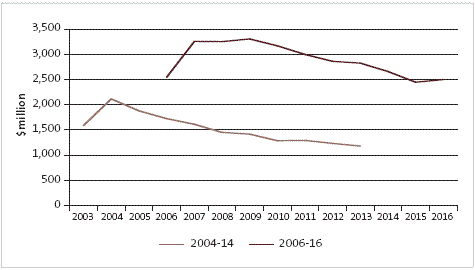
Figure 14
Comparison of forecast debt and investment in the 2004-14 and 2006-16 LTCCPs
3.71
As shown in Figure 13, there is a large increase in capital expenditure from $2,500 million (as shown in the 2005/06 annual plans) to $3,200 million in 2006/07 (year 1) of the 2006-16 LTCCPs. In the 2004-14 LTCCPs, capital expenditure decreased from the high point in the first year. The 2006-16 capital expenditure is forecast at a relatively constant level for the first three years of the plan. This suggests that the forecasts in the early years at least may be more reliable than the previous LTCCPs.
3.72
In the 2006-16 LTCCPs, the capital expenditure forecast decreases significantly after the 2008/09 year. The forecast capital expenditure for 2016 is $2,500 million – a decrease of 21% from 2006/07. It must also be noted that the 2006-16 forecasts include the effects of price change, which if excluded would likely result in the decrease being about equivalent to the 43% decrease noted in the 2004-14 LTCCPs.
3.73
Many LTCCPs included significant capital expenditure in the early years to enhance the treatment of wastewater in anticipation of future resource consents relating to the introduction of the New Zealand Drinking Water Standards.
3.74
Local authorities with high growth also appear to be constructing assets earlier in the planning period. All these factors may account for an element of the peak in capital expenditure in the early years of the LTCCPs and, therefore, affect the overall decrease shown in Figure 13. However, history suggests that local authority capital expenditure does not decrease on a year-to-year basis.
3.75
In our view, the reasons for the significant decrease in the later years are counterintuitive and need more research and understanding.
3.76
During the LTCCP audits, we became aware of the difficulties local authorities faced in forecasting capital expenditure. Local authorities typically adopted the approach that they would include forecasts only for actual "known" projects. Consequently, in non-infrastructure asset areas that may be more discretionary in nature or where there is no equivalent to an asset management plan, it is less likely that this expenditure will be included in the LTCCP in the later years. Examples in this area include expenditure related to economic development, such as convention centres, or other community facilities such as pools, libraries, and parks.
3.77
An alternative approach to capital expenditure forecasting would have been to include general assessments of other capital expenditure in addition to known projects. This assessment could have considered historical levels of capital expenditure or a capital expenditure envelope defining the probable and affordable level of capital expenditure for the local authority. In developing future LTCCPs, the sector and auditors need to explore this option to assess whether it would be more appropriate.
3.78
Linked to the drop-off in capital expenditure and potentially indicative of the focus on the first three years of the LTCCPs is the cash flows forecast for the 10 years of the plan and the resultant cash and investment balances. Figure 4, earlier in this Part, highlights an apparent change in the financial management strategy indicated by increased funding of capital expenditure from operating revenues in the later part of the LTCCPs, rather than from debt.
3.79
It is possible this is because local authorities focus primarily on the first three years of the LTCCPs, giving less consideration to the forecasts for the rest of the plan. Possible contributing factors to those forecasts include an understatement of capital expenditure, which would mean that cash and investments would be spent on acquiring assets not shown in the LTCCPs.
3.80
Alternatively, for some local authorities, this could represent the build-up of reserves for the future replacement of assets beyond the period covered by the LTCCPs. In this second situation, the local authorities concerned need to consider why they appear to have increases in both cash and debt balances. Efficient financial management would suggest that a local authority would not borrow externally when the expenditure could be financed internally.
Our conclusions
3.81
Overall, there is evidence to suggest that the reliability of financial forecasts has improved – in particular, for the first three years of the 2006-16 LTCCP. Including price change has also resulted in a better representation of the financial future of the local government sector.
3.82
However, we have some doubts about the integrity of the forecasts in the later years of the LTCCPs, with improvements in forecasting required for the 2009-19 LTCCPs. The doubts are primarily about the integrity of capital expenditure forecasts in the later years of the plan and also how clearly LTCCP forecasts reflect local authorities’ financial strategies in those years – or at least in how those strategies are applied to preparing all of the financial information included in the LTCCPs.
3.83
The LTCCPs forecast that rates will continue to increase and will become a proportionately greater funding source in 2016 than in 2006. Rates are an important element in the doubling of surpluses during the 10 years of the plan. However, without further explanation by local authorities of their financial strategy, there is no apparent need for surpluses of this level.
3.84
The surpluses appear to be primarily used for funding capital expenditure, with 81% of total capital expenditure forecast in the LTCCPs to be funded from operating cash flows (which includes surpluses and depreciation). This raises questions around the prudence of the proposed approach, especially in terms of intergenerational equity.
3.85
The significant reliance on operating cash flow in the later years of the LTCCPs diff ers from the approach used in the first three years of the plans, where debt is a substantial funding source. Possible reasons for such a substantial change include capital expenditure in these years being incomplete and/or that the LTCCPs do not accurately reflect the financial strategy of local authorities for these years. Neither scenario is ideal and suggests that local authorities need to consider whether the LTCCPs appropriately reflect their financing strategies and capital expenditure intentions for the whole 10 years.
3.86
The changes between the LTCCP Statements of Proposal and the final LTCCPs occurred primarily in the first year of the plans, possibly indicating a short-term focus by local authorities. This cannot be substantiated, but we will compare rating levels proposed for local authorities’ 2007/08 annual plans to those proposed in the LTCCPs to see if this theory is correct.
3.87
The financial analysis and aggregation of the financial data included in this Part highlights some trends and possible issues within the local government sector’s financial approach. The sector needs to analyse the financial information in the LTCCPs and consider the issues further.
1: Seventy-seven local authorities completed 2004-14 LTCCPs, and all 85 local authorities completed the 2006-16 LTCCPs.
2: Generally, the term "price change" or "cost change" is used interchangeably with "inflation". It is important to note that it is an assumption of future price change at rates specific to the individual local authority. This often is different from the rate known as the Consumer Price Index (CPI). For further discussion about price change, see paragraphs 3.64-3.67.
3: See paragraphs 7.18-7.25 for further discussion of the balanced budget requirement.
4: The 2006 information was collated from the 2005/06 annual plans of all local authorities. The 2006-16 LTCCPs were not required to include comparative information for the 2006 year, so this was not included in many instances.
5: Balances for equity and property, plant, and equipment are both affected by the revaluation of property, plant, and equipment.
6: Overall, investments are estimated to increase by $3,400 million compared to the 2005/06 annual plans. However, this includes Manukau City Council’s reclassification of property, plant, and equipment to investments, and changes in investment values (including revaluations made by other local authorities between the publication of their annual plan and their LTCCP) that affect this figure.
7: For further discussion about surpluses, particularly in relation to the balanced budget concept and prudent financial management, see Part 7.
8: The cumulative cash flows indicate net borrowing of $5,500 million. It is likely that this is because the 2006 comparative information used to prepare the LTCCPs differed from the 2005/06 annual plan debt figures.
9: It is important to note that this is from an analysis of external debt only and does not reflect local authorities’ internal debt programmes, in which funds are lent between activities. The receiving activity is charged interest, which is recovered from that activity’s revenues. This practice efficiently uses cash balances to avoid incurring external financing costs.
10: For a further explanation of the balanced budget concept, see paragraphs 7.18-7.25.
11: If Auckland City Council is excluded, rates in the remaining 84 local authorities’ final LTCCPs were 2.1% lower than those in the LTCCP Statements of Proposal.
page top
