Part 1: Introduction
Background
1.1
Dwelling burglary is an invasive and high incidence crime, and is a major cause of concern for many New Zealanders. The Government’s crime reduction strategy has targeted burglary as a priority crime for reduction. The New Zealand Police (the Police) have aligned their own strategic outcomes to the Government’s crime reduction strategy, and identified reducing burglary as a 3- to 5-year priority outcome.
1.2
In 2001, we published a report on what the Police were doing to investigate and prevent dwelling burglaries, and made some recommendations.1 The Police recognised our findings in their National Dwelling Burglary Reduction Strategy, released in December 2002.
1.3
As part of the consultation on our Annual Plan for 2004-05, members of Parliament asked us to consider following up on progress made by the Police since our 2001 report. We agreed to this request, given the ongoing significance of dwelling burglary to New Zealanders, and the prioritisation by the Police of reducing the incidence of dwelling burglary.
Dwelling burglary scale and trends
1.4
Burglary is defined under the Crimes Act 1961 (section 231) as any entering of a building or ship with intent to commit a crime or, having entered a building or ship, remaining in it without authority and with intent to commit a crime.2 The legal definition of “building” includes permanent or temporary buildings or structures of any description, including tents, caravans, or houseboats. It also includes enclosed yards, and closed caves or tunnels.
1.5
Dwelling burglary includes only residential dwellings. It accounts for just over 9 percent of all recorded offences in New Zealand.3
1.6
Victimisation surveys suggest a high level of public fear of being burgled. A national survey of crime victims, for example, found that just over one-third of survey respondents believed crime was a problem in their neighbourhoods, with burglary identified as a problem significantly more than any other crime.4 More than half of the burglary victims stated in the 2001 survey that they were affected either “very much” or “quite a lot” by being burgled.
1.7
Police crime statistics are used to monitor burglary offending levels.5 There are 2 main aspects to monitoring dwelling burglary offences – the number of recorded offences, and the proportion of those recorded offences that are classified as resolved by the Police. A recorded offence is an offence that the Police are made aware of. A recorded offence is considered by the Police to be resolved when, after investigation, the likely offenders are identified and a decision is made on the action to be taken against them.
Trends in the number of recorded dwelling burglary offences
1.8
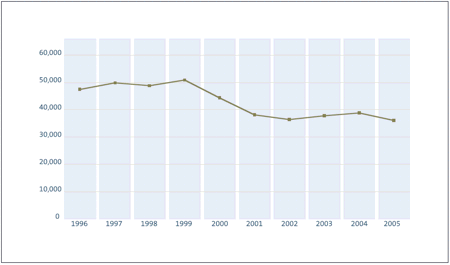
The number of recorded dwelling burglary offences between 1996 and 2005 is presented in Figure 1. Nationally, the number of recorded dwelling burglary offences dropped significantly, from around 50,000 each year in the late 1990s, to just over 36,000 in 2002. Since then, the number of recorded dwelling burglary offences increased slightly until 2004, before dipping again in the year to June 2005 to reach its lowest level in the last decade.
Figure 1
Total recorded dwelling burglary offences 1996-2005
There has been an overall decline in recorded dwelling burglary offences between 1996 and 2005 (data is for the years ended 30 June).
Source: Office of the Police Commissioner (2005), New Zealand Crime Statistics 2004/2005.
1.9
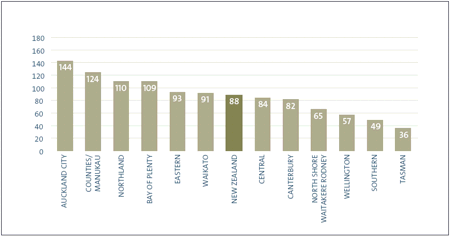
Regionally, the incidence and trends of dwelling burglary offences vary widely. New Zealand has 12 Police Districts. There are 9 in the North Island, and 3 covering the South Island and Stewart Island. See Figure 2. To help compare crime statistics between Districts with different populations, the statistics are often presented on a per-population basis. Figure 3 shows that, in 2004-05, the number of recorded dwelling burglaries for every 10,000 people ranged from 36 in the Tasman District, to 144 in the Auckland City District. The national average was 88 dwelling burglaries for every 10,000 people.
Figure 2
Map of Police Districts
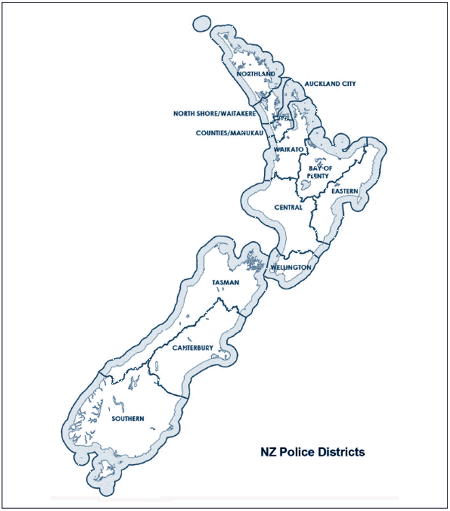
Figure 3
Rate of dwelling burglary offences per 10,000 people 2004-05, by Police District
Police Districts with larger populations tend to have higher rates for every 10,000 people than Districts with smaller populations (data is for the year ended 30 June 2005, and has been rounded to whole numbers).
Source: Office of the Police Commissioner (2005), New Zealand Crime Statistics 2004/2005.
1.10
Most Districts have generally had a reduction in the number of recorded dwelling burglary offences since 1999-2000, although several appear to have remained largely unchanged since 2001. A notable exception is the Northland District, which has experienced an increase in the number of dwelling burglaries over the past couple of years.
Trends in the proportion of dwelling burglaries that are resolved
1.11
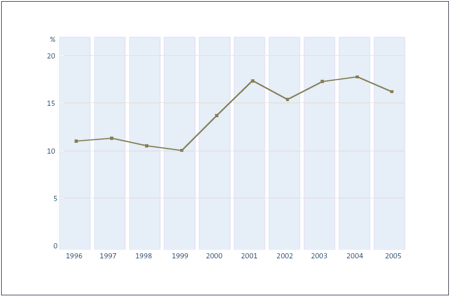
On a national basis, the resolution rate for recorded dwelling burglaries has hovered around 15-18% since 2001. A sharp improvement in the proportion of dwelling burglaries resolved between 1999 and 2001 ended a trend apparent in the late 1990s for the national resolution rate to remain at around 10-11%. These trends are shown in Figure 4.
Figure 4
Resolution rates for dwelling burglary 1996-2005
There has been an upward trend in the proportion of resolved dwelling burglaries between 1996 and 2005 (data is for the years ended 30 June).
Source: Office of the Police Commissioner (2005), New Zealand Crime Statistics 2004/2005.
1.12
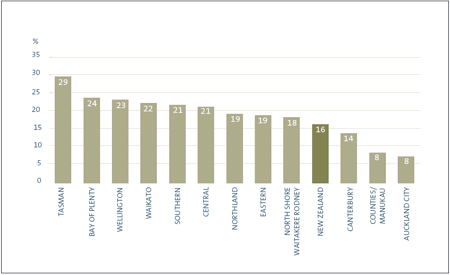
The resolution rates for dwelling burglary offences vary greatly between Police Districts. Figure 5 shows that, in 2004-05, resolution rates for dwelling burglary offences ranged from only 7.5% for the Auckland City District to nearly 29.4% in the Tasman District. Districts with higher populations tend to have lower resolution rates. This skews the national average towards the lower end of the range. Because of this, all but 3 Districts had resolution rates above the national average for the 2004-05 year.
Figure 5
Resolution rates for dwelling burglary 2004-05, by Police District
Police Districts with smaller populations tend to have higher resolution rates for every 10,000 people than Districts with larger populations (data is for the year ended 30 June 2005, and has been rounded to whole numbers).
Source: Office of the Police Commissioner (2005), New Zealand Crime Statistics 2004/2005.
How we conducted our follow-up audit
1.13
We examined whether the way the Police deal with dwelling burglary has improved since our 2001 report.
1.14
We used a case study approach for this follow-up. The Police are nationally organised into the Office of the Commissioner, 12 Districts, and 12 Service Centres (such as police training, information technology, and communication centres). The 12 Districts are divided into 44 local operational units called Areas. Each Area can have several Police Stations within its boundary.
1.15
We concentrated our fieldwork on a review of documentation, and interviews at the Office of the Commissioner, the Royal New Zealand Police College, and 4 Police Areas.
1.16
The 4 Police Areas we visited were Christchurch Central, Counties-Manukau East, Kapiti-Mana, and Waikato West. We selected these 4 Areas so our case studies would cover:
- urban and rural areas;
- areas with different socio-economic characteristics; and
- areas with varying rates of recorded dwelling burglary offences.
1.17
Figure 6 summarises the characteristics of each of the 4 Areas that influenced our decision to select them.
Figure 6
Characteristics of the selected Police Areas
| Police Area | Reason for selection |
|---|---|
| Christchurch Central | Urban area with pockets of high affluence. A District subject to recent organisational restructuring. |
| Counties-Manukau East | Rapidly growing population with diverse socio-economic characteristics and conditions. High incidence of crime. Part of a District (Counties-Manukau) with sustained high burglary offending rates and low resolution rates since 2001. |
| Kapiti-Mana | Diverse socio-economic characteristics and conditions. Suburban, but with some semi-rural areas. Part of a District (Wellington) that has experienced a reduction in burglary offending rates since 2001. |
| Waikato West | Predominantly rural population with some lower socio-economic characteristics. |
1.18
In each Area, we interviewed a range of staff, including:
- Area Commanders;
- Officers in charge of investigations;
- Intelligence section managers and analysts;
- Scene of Crime Officers (SOCOs); and
- Frontline6 officers.
1.19
We also examined documents, and interviewed District Commanders and Policing Development Managers, for the Districts covering the 4 selected Areas.
1: The Police: Dealing with Dwelling Burglary.
2: The legal definition of burglary has been changed since our 2001 report. The Crimes Amendment Act 2003 broadened the definition of burglary by removing the element of breaking. Simply entering a building with intent to commit a crime is now sufficient for the off ence to be classified as a burglary. Consequently, some offences that would previously have been defined as thefts are now recorded as burglaries. Some implications of this widened definition are discussed in Part 5.
3: Office of the Police Commissioner (2005), New Zealand Crime Statistics 2004-2005.
4: Morris, A; Reilly, J (2003), New Zealand National Survey of Crime Victims 2001, Ministry of Justice, page 28.
5: Police crime statistics rely on relatively consistent definitions and a complete record of a validated and reported crime. The Police consider recorded crime statistics to be a reliable indicator of the level of burglary offending because insurance companies usually require a Police report before accepting insurance claims.
6: According to the Police, “frontline” officers deal directly with the public.
page top
