Summary Annual Report 2003-04

“The Office has continued to face ongoing pressures on our ability to respond. Yet, over the 2003-04 year, we have delivered our outputs and, at the same time, developed our Strategy for the next five years. This has positioned us well for the future.”
It is my pleasure to present this Summary Annual Report for the year ended 30 June 2004. This Summary provides information about the major achievements of the Office and extracts from our full Financial Report. It is intended to give a sense of the financial and non-financial performance of the Office.
This year, in our Annual Report, we have tried to “tell it like it is”, and to model an example of good practice in the reporting of outcomes, governance, risk and capability. This means that we have attempted to better show the link between what we set out to achieve in our Annual Plan 2003-04, and what we actually did.
I am proud of the achievements of the Office over the past year. We have faced ongoing pressures on our ability to respond, given the extent of change in the profession and in the operating and legislative environments of public entities. In addition, we have been called upon more to undertake high profile and complex inquiries. Amid this environment, we have delivered our outputs and, at the same time, developed our five-year Strategic Plan. This has positioned the Office to better meet the needs of our key stakeholders – Parliament and the public.

K B Brady
30 September 2004
Major achievements for 2003-2004
Preparing our Strategic Business Plan
We have done a lot of work to develop a clear Strategy for the next five years. This work has:
- identified the capability we need for the future, especially to meet the changes in the profession and in the operating and legislative environments of public entities;
- reviewed the work the Office does and confirmed its ongoing relevance, but suggested some enhancements in key areas; and
- set us on a path to be more innovative and responsive to our stakeholders’ needs and to work more collaboratively internally and externally.
On the basis of this work, Parliament has provided increased baseline funding for the Office.
Implementing changes to the way we appoint auditors to carry out annual audits
We reviewed the contestable audit model in 2002-03 and made the decision to move to an “audit resourcing model” where the Controller and Auditor-General would allocate annual audits to audit service providers. During the 2003-04 year, we fully introduced this new model. This has resulted in:
- a reallocation of some audits to alternative auditors;
- stability in Audit New Zealand’s portfolio, with a more predictable fee base; and
- stable and more sustainable portfolios for private sector firms, with stronger sector specialisation and regional concentration.
Some audits of entities with a strong commercial focus will continue to be subject to contestability.
Enhancing our management of the Office and especially our capability
We continued to look for ways to improve our management and governance of the Office, and to maintain and enhance our capability. Key achievements were:
• we implemented our Risk Management framework and integrated this with our business planning process; • we developed an Information Systems Strategic Plan; • we saw many examples of “closer working” – internally and externally; • we introduced a project office approach to how we manage our work; and • we reviewed and implemented a new leadership model.
Delivering our outputs – key results
Public reports issued
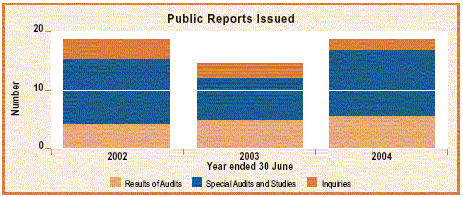
- We produced a total of 18 public reports against a target of 12.
- The level of unprogrammed inquiries has continued at similarly high levels as the previous year (i.e. 6).
- However, the Office has this year still been able to fully deliver its programmed work target. This has been achieved largely as a result of process efficiencies.

Financial report audits
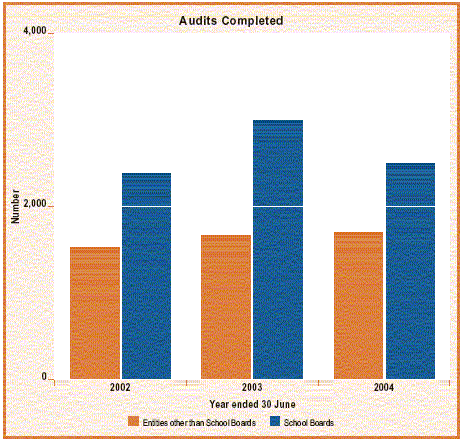
- We completed 4070 audits of public entities in 2003-04 (4192 in 2002-03).
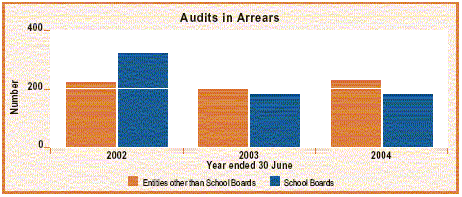
- Audits in arrears were slightly higher than the previous year. The increase falls mainly within “Miscellaneous public bodies” and reflects ongoing issues our auditors experience with small trusts.
- There has been a good improvement in the timeliness of management reports.
- Overall, in relation to audit reports, there remain timeliness issues.

Responding to inquiries
- The number of inquiries was higher than the previous year (179 compared to 162).
- Inquiries continue to be of increasing complexity and higher profile.
- Our timeliness in this area continues to need some improvement.

Making a difference – Our outcomes
Over the 2003-04 year, the Office sought to maintain and/or improve, as a result of its work, its desired impacts. Key outcomes were:
- We saw ongoing strengthening of entity management, evidenced through our comparison of the five management aspect results for 2002-03 compared to 2001-02.
- Select Committees continued to draw from our advice to make their own recommendations at the rate of 74%.
- New Zealand maintained its ranking on the Transparency International Corruption Perceptions Index.
Summary Financial Report of the Controller and Auditor-General for the year ended 30 June 2004
Financial performance and financial position
| |
2004 Actual $000 | 2004 Forecast* $000 | 2003 Actual $000 |
|---|---|---|---|
| The revenue we earned was:
We received this revenue from the following sources: • $35,175,000 of audit fees from public entities. • $5,637,000 from the Crown, which included a funding increase from the previous year of $306,000. |
40,812 | 39,306 | 39,699 |
| Our total expenditure was:
The amounts spent on each activity are shown on the opposite page. The main things we spent money on were personnel costs ($19,278,000), fees paid to contracted auditors ($12,861,000), and other day-to-day operating costs ($8,515,000). All our spending was within the limits set by Parliamentary appropriations. |
40,654 | 39,052 | 39,548 |
| Our surplus for the year, which is returned to the Crown, was: | 158 | 254 | 151 |
| Our total assets at 30 June were: | 10,131 | 9,558 | 9,276 |
| The assets consisted of: | |||
| • Current assets – including cash $3,040,000, work in progress $1,272,000, and receivables $3,064,000. | 7,911 | 7,148 | 7,239 |
| • Non-current assets – the physical assets we own or lease. | 2,220 | 2,410 | 2,037 |
| Our liabilities at 30 June were: | 6,545 | 5,972 | 5,690 |
| The liabilities consisted of: | |||
| • Current liabilities – including payables and provisions $2,872,000, and provision for employee entitlements $2,076,000. | 5,465 | 4,854 | 4,704 |
| • Non-current liabilities – mostly provision for employee entitlements $795,000. | 1,080 | 1,118 | 986 |
| Movements in our taxpayers’ funds were: | |||
| Opening balance at 1 July. | 3,586 | 3,586 | 3,586 |
| Surplus for the year (total recognised revenues and expenses). | 158 | 254 | 151 |
| Provision for payment of surplus to the Crown. | (158) | (254) | (151) |
| Closing balance at 30 June. | 3,586 | 3,586 | 3,586 |
| Our net increase/(decrease) in cash held was: | 1,625 | 43 | 949 |
| The net cash flows were from: | |||
| • Operating activities. | 2,844 | 1,279 | 2,160 |
| • Investing activities. | (1,068) | (1,085) | (532) |
| • Financing activities. | (151) | (151) | (679) |
* The amounts shown as Forecast in this Summary Financial Report were prepared as part of the Budget Estimates and Supplementary Estimates process, which are unaudited.
|
This Summary Financial Report:
The full Financial Report can be found on pages 119-164 of our Annual Report 2003-04 – available in hard copy by telephoning 04 917-1500, and on our web site www.oag.govt.nz. |
Summary Financial Report of the Controller and Auditor-General for the year ended 30 June 2004
Service performance
| Activity | 2004 Actual | 2004 Target/Forecast* | 2003 Actual |
|---|---|---|---|
| Reports and advice to Parliament and the public | |||
| • Number of public reports issued | 18 | 12 | 15 |
| • Number of reports to Select Committees | 153 | 160 | 205 |
| • Responses to enquiries from taxpayers, ratepayers, & MPs | 179 | 300 | 162 |
| Cost | $5,242,000 | $5,280,000 | $4,955,000 |
| Controller function
We monitor, on behalf of Parliament, the issue of funds from the Crown Bank Account, to ensure that releases of funds are supported by appropriations, and are for lawful purposes. |
|||
| • Number of Controller statements certified | 249 | 245 | 245 |
| Cost | $252,000 | $260,000 | $238,000 |
| Audits of entities that have not been offered the opportunity to have the audit tendered | |||
| • Number of audits completed | 338 | 338 | 401 |
| • Audits completed within deadlines | 44% | 80% | 45% |
| • Management reports sent within 6 weeks | 100% | 100% | 97% |
| • Audit arrears at year end | 115 | 170 | 117 |
| Cost | $3,474,000 | $4,006,000 | $3,658,000 |
| Audits of other entities and other audit-related work | |||
| • Number of audits completed | 3,732 | 3,724 | 3,791 |
| • Audits completed within deadlines | 40% | 60% | 37% |
| • Management reports sent within 6 weeks | 97% | 100% | 96% |
| • Audit arrears at year end | 282 | 180 | 255 |
| Cost | $31,686,000 | $29,506,000 | $30,697,000 |
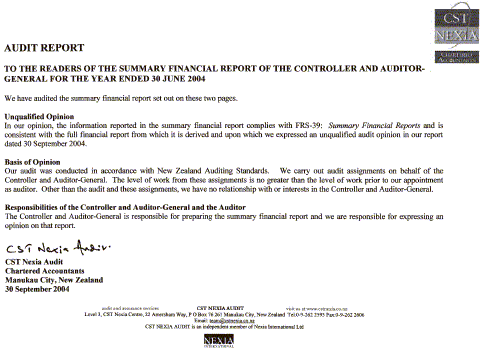
Audit Report

