Part 2: Trends in councils' financial and infrastructure strategies
2.1
Financial strategies and infrastructure strategies are the core components of long-term plans. They include information that underpins the long-term plan's content. Financial strategies are typically for the next 10 years, but infrastructure strategies must look ahead at least 30 years.
2.2
In this Part, we discuss some of the trends we have observed in council long-term plans, drawing on information in these strategies.
Operating expenses are forecast to be 38% higher than previously planned
2.3
Councils are facing significant cost pressures. In recent years, high inflation and interest rates have increased costs for councils. Many councils are also experiencing increasing demand for their services while addressing the consequences of decades of underinvestment in infrastructure assets.
2.4
The cost of insuring council assets has also increased significantly in recent years. Climate change has increased the risks of floods, storms, and other weather events, which has affected insurance premiums. Insurance costs have also risen particularly sharply for councils in regions that are at higher risk of earthquakes.
2.5
For the 58 councils, total annual operating expenditure is forecast to increase from $16.2 billion in 2024/25 to $23.2 billion in 2033/34. Compared to the same councils' 2021-31 long-term plans, total operating expenditure is forecast to be 38% higher. Figure 3 shows the main reasons for this increase.
2.6
At $21.5 billion, interest expenses are forecast to be 108% higher than forecast in the 2021-31 long-term plans. Expenditure on interest will be 17% of forecast rates revenue. Figure 4 shows how interest expense will trend over time, compared with rates revenue.
2.7
Interest rates were a significant assumption that our auditors considered. They assessed whether councils' assumptions about interest rates were in line with economic forecasts. Our audit opinions did not identify any significant issues with these assumptions.
Figure 3
Total forecast operating expenditure by type in councils' 2021-31 and 2024-34 long-term plans
| 2021-31 long-term plans | 2024-34 long-term plans | Percentage change | |
|---|---|---|---|
| Employee costs | $27.7 billion (32% of rates revenue) |
$36.7 billion (30% of rates revenue) |
+32% |
| Interest expense | $10.3 billion (12% of rates revenue) |
$21.5 billion (17% of rates revenue) |
+108% |
| Depreciation and amortisation | $34.5 billion (40% of rates revenue) |
$47.1 billion (38% of rates revenue) |
+37% |
| Other operating expenses | $70.8 billion (82% of rates revenue) |
$92.3 billion (74% of rates revenue) |
+30% |
| Total operating expenses | $143.3 billion | $197.5 billion | +38% |
Note: Other operating expenditure can include items such as repairs and maintenance, electricity, ACC levies, discretionary grants/contributions, rental and operating lease costs, "bad debts" written off, maintenance contracts, and impairment provisions for property, plant, and equipment.
Figure 4
Interest expense and rates revenue in councils' 2021-31 and 2024-34 long-term plans

Revenue is forecast to increase by 37% compared to the 2021-31 long-term plans
2.8
For the 58 councils, revenue is forecast to be $233.1 billion for the 2024-34 period (an increase of 37% on the $169.6 billion forecast for 2021-31). Revenue is forecast to increase from $18.7 billion in the first year (2024/25) to $27.4 billion in 2033/34. This is an increase of 46% over the 10 years.
Councils plan to increase rates sharply – particularly in the first years of the plans
2.9
Rates typically make up slightly more than half of all council revenue. In the 2024-34 long-term plans, rates will make up 53% of revenue.
2.10
Other sources of revenue include subsidies and grants (such as from the New Zealand Transport Agency Waka Kotahi and other government funding) and other revenue (such as from the fees that councils charge for some services). Figure 5 shows the proportions of these different sources of revenue.
Figure 5
Sources of forecast council revenue in 2021-31 and 2024-34 long-term plans

2.11
When deciding to increase rates, councils aim to strike a balance between making rates affordable and receiving enough revenue to provide services and to renew and maintain their infrastructure to required standards. Councils should also consider the consequences of financial decisions on both current and future generations.
2.12
In the 2024-34 long-term plans, rates are forecast to increase more sharply than in previous long-term plans, particularly between 2026 and 2028.
2.13
For the 58 councils, total rates revenue is forecast to be $124.5 billion for 2024-34. This is a 45% increase on the $86 billion that the same 58 councils forecast in their 2021-31 long-term plans. Councils plan to increase rates steeply in 2026 and 2027 (on average, by 10.4% in 2026), after which they plan to steadily reduce rates rises (see Figures 6 and 7). This follows a similar pattern to previous long-term plans.
Figure 6
Forecast rates revenue for all councils in their last three long-term plans

2.14
Figure 7 shows that councils tend to forecast higher rates increases in the early years of long-term plans. Although this is likely to reflect the certainty councils have about their revenue forecasts, it may also indicate that councils could improve their forecasting beyond the first three years of long-term planning periods.
Figure 7
Average percentage increase in rates in councils' last three long-term plans

Councils are planning to address deferred maintenance
2.15
Local government owns and operates 26% of New Zealand's infrastructure assets.11 This includes essential services such as three waters services, waste management, and roads. Councils also own and operate community facilities, parks, and land assets.
2.16
Together, these assets have a value of at least $76 billion.12 The decisions councils make about how and where to invest in these assets have long-term, inter-generational implications for their communities.
2.17
For many years, we have reported that councils have not been spending their capital expenditure budgets and have not replaced assets as fast as those assets have been "run down". The result is a widespread backlog of repairs, maintenance, and renewals.
2.18
Most councils are also dealing with an infrastructure deficit. The causes of this deficit can go back decades.
2.19
Councils were not legally required to fund depreciation (that is, set aside money to replace the use of existing assets) until 1996.13 There was significant underinvestment in infrastructure from the late 1980s to the 1990s.
2.20
As a result, the condition of the infrastructure that some councils manage has deteriorated. This is now significantly affecting some councils' levels of service, particularly water services.
2.21
When we audited the 2021-31 long-term plans, councils were planning to increase investment in infrastructure. This has continued in the 2024-34 long-term plans.
2.22
Financial and infrastructure strategies show that the 58 councils are forecasting to invest more in their assets than in previous years. Total capital expenditure during 2024-34 is forecast to be $91.9 billion – a 34% increase on forecasts in the 2021-31 long-term plans.
2.23
Of this, councils plan to spend $23.5 billion on new assets (to meet additional demand), $29 billion on improving levels of service, and $39.5 billion on renewing existing assets.
2.24
We compare renewals spending to depreciation because depreciation is a reasonable measure for estimating the portion of the asset that will run down during a financial year.
2.25
A gap between renewals expenditure and depreciation provides some indication that councils will not be replacing infrastructure at the same rate as it is being run down. However, because assets have long life cycles, this is only one indicator of whether councils are reinvesting enough in their assets.14
2.26
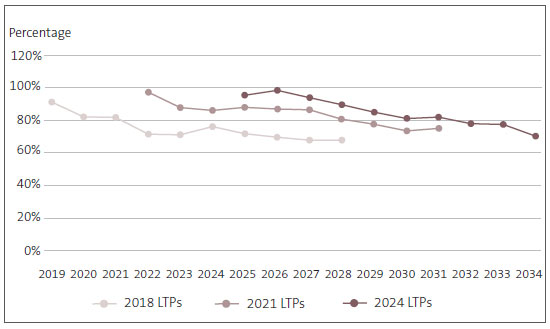
Figure 8 sets out the proportion of forecast renewal expenditure to forecast depreciation for the last three long-term plans. This shows that renewals expenditure is forecast to be around 100% of forecast depreciation in the early years of 2024-34 but will then decrease steadily over time. This pattern featured in the 2021-31 long-term plans.
2.27
During 2024-34, forecast renewals expenditure will be, on average, 85% of forecast depreciation. This compares to the 82% forecast in the 2021-31 long-term plans.
2.28
Although this is an improvement, councils still might not be planning to reinvest enough in their assets to maintain levels of service.
Figure 8
Average forecast renewals expenditure as a percentage of forecast depreciation in councils' last three long-term plans
Councils are planning to invest more in their water assets
2.29
Many councils are faced with significant challenges associated with ageing water infrastructure. In their long-term plans, councils have reported and acknowledged the consequences of these challenges.
2.30
The historical underinvestment in water infrastructure assets is affecting service levels. In our recent article about councils' reporting on the quality of their drinking water,15 we highlighted that councils achieved just under 60% of their targets for water supply measures in 2022/23. That was a lower result than for the previous two years, when councils achieved about 66% of the targets.
2.31
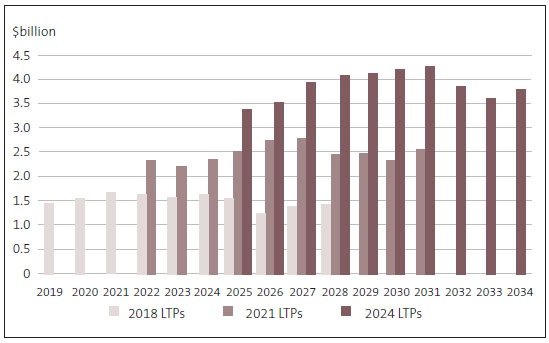
The 58 councils forecast to spend $24.6 billion on three waters assets in their 2021-2031 long-term plans. The same councils are planning to spend $38.6 billion on these assets during 2024-34 – an increase of 57%.
2.32
Councils report that their main reasons for investing more in three waters assets are a combination of meeting increasing demand from population growth, addressing infrastructure deficits, cost escalation (exacerbated by a workforce shortage in the construction industry), and the need to improve service levels.
2.33
Figure 9 compares the capital expenditure on three waters that councils planned in their 2018-28, 2021-31, and 2024-34 long-term plans.
Figure 9
Councils' total planned capital expenditure on three waters assets in their last three long-term plans
2.34
Figure 10 shows that councils plan to reinvest more in water supply assets compared to depreciation (113%). This indicates that councils are seeking to address the infrastructure deficit to improve drinking water service levels.
2.35
However, Figure 10 also shows that the proportion of forecast renewal expenditure to forecast depreciation is much lower for stormwater than for other water assets. We also saw this in the 2021-31 long-term plans.
2.36
This could be of concern, particularly given the increasing frequency of severe weather events associated with climate change.
Figure 10
Proportion of renewals expenditure to forecast depreciation for three waters assets in councils' last three long-term plans
| Water asset activity | Capital expenditure as a percentage of depreciation: 2018-28 | Capital expenditure as a percentage of depreciation: 2021-31 | Capital expenditure as a percentage of depreciation: 2024-34 |
|---|---|---|---|
| Water supply (drinking water) | 83% | 123% | 113% |
| Wastewater treatment and disposal | 66% | 96% | 87% |
| Stormwater and drainage | 53% | 51% | 43% |
Councils' knowledge about their assets' condition and performance
2.37
Councils need good information to inform their decisions and plans for renewing and maintaining their infrastructure. We have regularly reported that councils need to prioritise collecting information about the condition and performance of their critical assets, such as water services, infrastructure, and roads.
2.38
Councils have been working to improve the information that they have about the condition and performance of their critical assets. However, we continue to find that when some councils forecast renewals and maintenance expenditure, they base these decisions on the age of the assets, rather than on condition and performance information.
2.39
Age is only one indicator of when an asset might need replacing. In theory, it is reasonable to expect that an older asset will require replacement before a newer asset. In practice, the opposite might be true depending on the condition and performance of the asset. Making investment decisions based on the asset's age rather than on its condition and performance increases the risk that the asset is planned to be replaced either earlier or later than required.
2.40
If the plan is to replace later (based on age) than required (based on condition and performance), this increases the risk of asset failure and reduced levels of service. It could also lead to councils incurring expenditure on assets before it is necessary to do so.
2.41
Once those councils that deferred their long-term plans until 30 June 2025 have adopted them, we plan to report on councils' infrastructure strategies further to consider whether councils are improving their knowledge about the condition and performance of their critical assets.
The impact of water reform on councils' long-term plans
2.42
As we mentioned in Part 1, the Local Government (Water Services) Bill 2024 was introduced in December 2024. This sets out arrangements for water services delivery and regulatory systems.
2.43
The Bill provides five water service delivery models for councils to choose from:
- Model 1, an in-house business unit (the current delivery model for many councils);
- Model 2, a single council-owned water organisation;
- Model 3, a multi-council-owned water organisation;
- Model 4 mixed council/consumer trust-owned water organisation; and
- Model 5, a consumer trust-owned water organisation.16
2.44
Although councils would need to adhere to the principles and settings of the Local Water Done Well framework, they could choose which of the models is the best option for their communities.
2.45
Under Local Water Done Well (specifically, the Local Government (Water Services) Bill 2024), councils that opt for:
- Model 1 would retain their water assets;
- Models 2, 3, and 4 can choose to transfer their water assets to a different type of water organisation; and
- Model 5 would transfer their water assets to a water organisation owned by a consumer trust.
2.46
The impact of water reform on councils' long-term plans would depend on which water services delivery model a council selected and, where applicable, whether a council chose to transfer its water assets. Transferring a council's water assets to a water organisation would significantly impact that council's long-term plan.
2.47
Councils that have already adopted their long-term plans might need to amend these plans if the chosen model in the Water Services Delivery Plan is significantly different from what was in the adopted long-term plan.
2.48
The 12 councils that have deferred adopting their long-term plans by 12 months (until 30 June 2025) are preparing their Water Services Delivery Plans under Local Water Done Well at the same time as they prepare their 2025-34 long-term plans.
2.49
The councils' 2025-34 long-term plans should reflect their intentions for future water services delivery, as set out in their Water Services Delivery Plans.
2.50
Until the legislation is passed and councils' water services delivery models and asset transfers are known, it is difficult to forecast or analyse the impact on councils' long-term plans and balance sheets (particularly on assets and debt). We will revisit our analysis once this information is available.
2.51
The Local Government (Water Services) Bill 2024 is currently being consulted on until 23 February 2025, meaning the Bill could change further before it is enacted.
Common risks to councils' delivery of their capital programmes
2.52
In recent years, we have found that councils generally budget to reinvest more in assets than they actually spend.17 We have previously reported that most councils have not delivered all their capital expenditure programmes and that some capital projects have either been delayed or not been delivered at all.
2.53
In 2021/22, councils collectively spent 76% of the $7.68 billion that they had budgeted for capital expenditure. This improved in 2022/23, when councils spent 94% of the $7.5 billion that they had budgeted.
2.54
Limitations on the construction industry's capacity, the high level of demand from councils, and uncertainty about external funding for capital projects create significant risks and challenges for councils in completing their capital programmes.
2.55
Fourteen of our audit reports on 2024-34 long-term plans drew attention to risks that councils will not be able to deliver their capital programmes. The capacity of available contractors in New Zealand is limited, and there is a high level of demand from local government.
2.56
Several councils are planning to significantly increase their capital programmes. Our audit reports noted that, if these councils do not deliver their programmes, they risk not meeting their planned levels of service or incurring greater costs during the long term.
2.57
Nineteen of our audit reports drew attention to uncertainty and assumptions that councils made about central government funding for capital projects. Much of this related to uncertainty about New Zealand Transport Agency Waka Kotahi funding.
2.58
Several councils had also made assumptions that we did not consider reasonable about levels of government funding for capital projects such as flood and shoreline protection.
2.59
Councils also considered the impacts of climate change in their infrastructure strategies. The future condition of councils' assets will be affected by the impacts of climate change – such as rising sea levels causing coastal inundation and flooding. This will impact councils' capital expenditure.
2.60
Because the timing and extent of the future impacts of climate change are uncertain, the effects on councils' infrastructure strategies are often difficult to determine. Once those councils that deferred their long-term plans until 30 June 2025 have adopted them, we will provide further analysis and comment on how councils have considered climate change in their long-term plans.
Councils plan to increase borrowing to finance investment in infrastructure
2.61
Councils use debt to spread the costs of building, maintaining, and renewing their long-term infrastructure. Debt financing infrastructure allows councils to share the costs and benefits of investments among those who benefit from them over time.
2.62
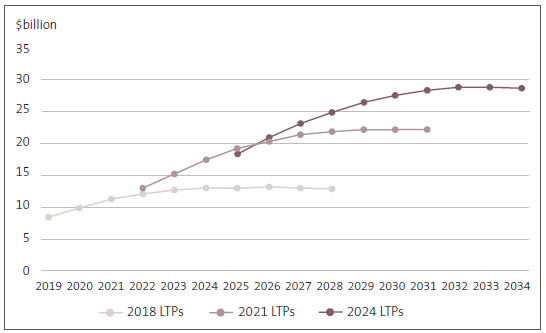
In their 2024-34 long-term plans, councils are planning to borrow at historically high levels (compared to previous long-term plans). Figure 11 shows that, excluding Auckland Council, total council debt is forecast to reach a peak of $28.8 billion in 2033. We separated Auckland Council's debt from other councils because it has historically accounted for more than 50% of the total debt for all councils.
Figure 11
Total forecast debt in councils' last three long-term plans, excluding Auckland Council
2.63
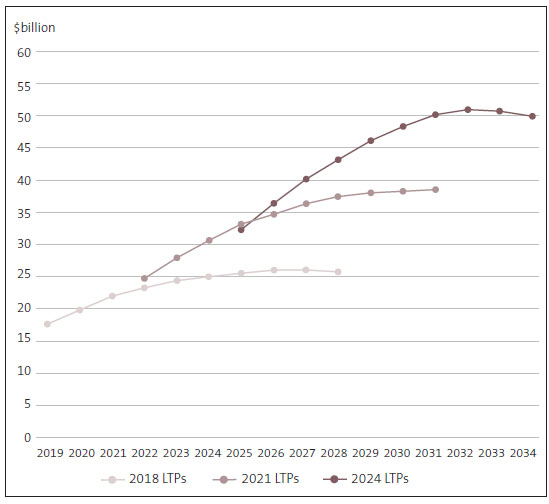
Figure 12 shows that, including Auckland Council, total debt is forecast to peak at $50.9 billion in 2032.
Figure 12
Total forecast debt in councils' last three long-term plans, including Auckland Council
Some councils have almost reached the debt limits in their financial strategies
2.64
Most councils borrow through the Local Government Funding Agency (the LGFA).
2.65
The LGFA sets limits on how much councils can borrow. These limits include a debt-to-revenue limit that prevents councils from borrowing more than 280% or 175% of their revenue, depending on their credit rating.
2.66
The LGFA recently announced that it is increasing its debt limit for high-growth councils to 350% of total revenue.18 Any increase in limit is also subject to the approval of the LGFA Board. It made this announcement after the 58 councils had prepared the long-term plans that we discuss in this report.
2.67
Most councils also set their own debt limits below LGFA limits. Keeping within their own debt limits means that councils would be able to borrow more to meet the costs of an unexpected event, such as an earthquake or severe weather.
2.68
Councils' own debt limits vary significantly. Some councils have debt limits that are much lower than LGFA limits. In some instances (such as Marlborough District Council, New Plymouth District Council, Waikato Regional Council, and Environment Southland), the limits are lower than, or close to, 100% of total revenue.
2.69
Other councils (such as Clutha District Council, Hauraki District Council, and Kāpiti Coast District Council) have not set separate debt limits from the LGFA.
2.70
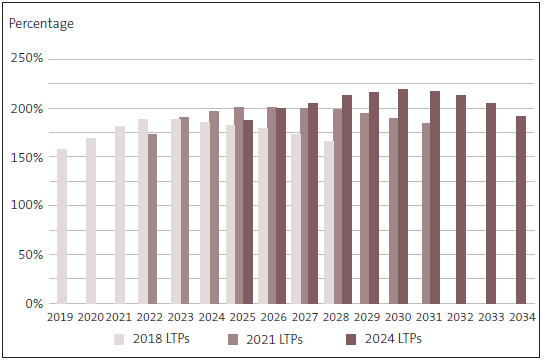
Figure 13 shows the average level of debt by councils as a percentage of total income (excluding Auckland Council). Borrowing by these councils will, on average, be at its highest in 2030 – at 204% of total revenue. Figure 14 includes borrowing by Auckland Council.
2.71
The forecast debt-to-revenue ratio is lower in 2024/25 than was forecast in the 2021-31 long-term plans. However, by 2028, the average debt to revenue ratio is forecast to be at historically high levels (200%).
2.72
Some councils' borrowing is forecast to get close to the LGFA limits. When councils are close to LGFA debt limits they might be less able to respond to the costs of unforeseen events, asset failures, or changes to the timing of their capital programmes.
2.73
For example, our audit reports on Hamilton City Council's and Tauranga City Council's long-term plans drew attention to risks associated with debt levels that will be close to the LGFA borrowing limits set at the time. This reduces the ability of these councils to borrow more than currently forecast within the 2024-34 period. However, we note that, after the LGFA's recent announcement, high-growth councils may now choose to extend their self-imposed debt limits.
2.74
Although borrowing for most other councils is well within LGFA limits, some councils are forecasting that they will be very close to or will exceed their self-imposed debt limits within the 2024-34 period.
Figure 13
Debt as a percentage of total revenue, excluding Auckland Council
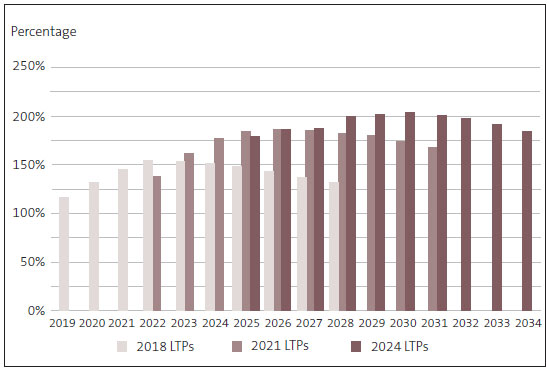
Figure 14
Debt as a percentage of total revenue, including Auckland Council
2.75
The costs of borrowing have risen sharply in recent years, and councils will need to carefully consider how further borrowing might affect their expenses over time. Some councils' credit ratings were downgraded after they adopted their 2024-34 long-term plans because of their weak financial positions and rising debt.
2.76
These downgrades will lead to relatively higher interest rates for those councils. This will increase their borrowing costs and could limit the amount of further debt that they can take on. This could also have consequences for their ability to fund the costs of unforeseen events or emergencies.
Only two councils are using special purpose vehicles to fund infrastructure investment
2.77
As well as borrowing from the LGFA, the Infrastructure Funding and Financing Act 2020 provides a mechanism for councils to finance infrastructure projects with help from the National Infrastructure Agency (formerly Crown Infrastructure Partners).
2.78
Under this Act, councils can, under certain conditions, access finance through special purpose vehicles. This provides councils with another option for financing infrastructure investment and is typically at a fixed rate for a longer term (for example: 30 years) than what the LGFA can offer.
2.79
By using a special purpose vehicle, councils can fund specific infrastructure projects through borrowing that is not included on the council's balance sheet and charge a levy to those who benefit from the infrastructure. This method of borrowing is not subject to LGFA debt limits.
2.80
Only two councils are currently using special purpose vehicles. They are Wellington City Council (to finance the Sludge Minimisation Facility) and Tauranga City Council (to fund the Western Bay of Plenty Transport System Plan).
2.81
There are few indications in long-term plans that councils plan to use the finance facilities available through the Infrastructure Funding and Financing Act 2020.
2.82
Palmerston North City Council had signalled its intention to fund several of its capital projects using the Act. These projects included the planned upgrade of its wastewater treatment and disposal system and the redevelopment of its central library.
2.83
However, the Council had not applied for funding under the Act when it prepared its long-term plan. This was one of the reasons for our adverse opinion of Palmerston North City Council's 2024-34 long-term plan.
2.84
Councils have indicated that the process of putting a levy in place under the Act can be complex and take considerable time and effort.
2.85
These factors might be acting as a barrier to councils choosing these arrangements. We understand that the Ministry of Housing and Urban Development is leading work on improving the Act.19
11 New Zealand Infrastructure Commission (2024), Build or maintain? New Zealand’s infrastructure asset value, investment, and depreciation, 1990-2022, page 6.
12 New Zealand Infrastructure Commission (2024), Is local government debt constrained? A review of local government financing tools, page 3.
13: New Zealand Infrastructure Commission (2024), Is local government debt constrained? A review of local government financing tools, page 44.
14: We use our comparison of depreciation with renewals as an indicator only. We expect any difference between the two to reduce during the life of an asset. When there is high growth, a higher proportion of capital expenditure is on non-renewal assets. Therefore, as a percentage of depreciation, renewals will trend downwards over time as non-renewal assets are capitalised.
15: Controller and Auditor-General (2024), "Testing the water: How councils report on drinking water quality", at oag.parliament.nz.
16: See "Water Services Policy Future Delivery System" at dia.govt.nz.
17: Controller and Auditor-General (2024), Insights into local government: 2023, at oag.parliament.nz.
18: See "LGFA increases borrowing capacity to support high growth councils" at beehive.govt.nz.
19: See Cabinet Paper ECO-24-SUB-0076: Improving Infrastructure Funding and Financing, 22 May 2024.

